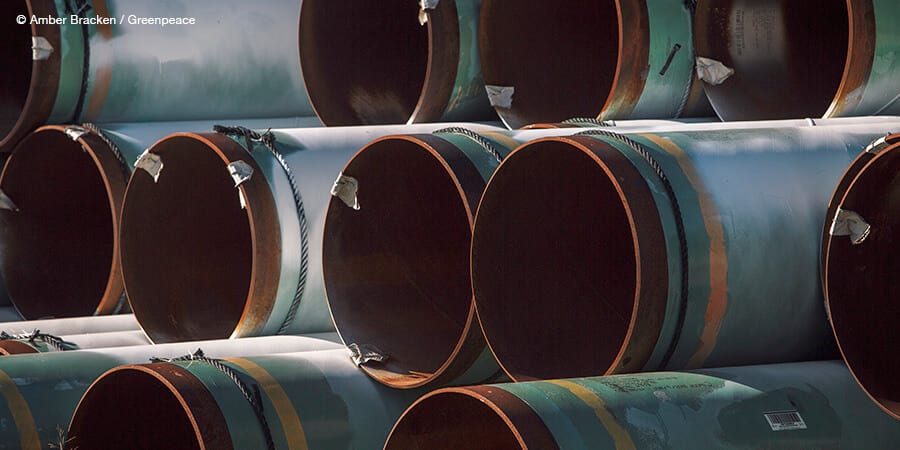
Dangerous Pipelines
Enbridge's History of Spills Threatens Minnesota Waters
Published: 11-14-2018
Download: PDF
Executive Summary
- Enbridge, which is proposing to expand its Line 3 pipeline through Minnesota, has a long track record of pipeline spills, both chronic small spills and large catastrophes.
- From 2002 to present, Enbridge and its joint ventures and subsidiaries reported 307 hazardous liquids incidents to federal regulators — one incident every 20 days on average. These spills released a total of 66,059 barrels (2.8 million gallons, or more than four Olympic-sized swimming pools) of hazardous liquids.
- Thirty Enbridge incidents were reported to contaminate water resources, including 17 which contaminated groundwater.
- This steady flow of oil spills puts Minnesota’s water, ecosystems, treaty rights, and communities at risk.
- The disastrous 2010 spill of 20,000 barrels (840,000 gallons) of tar sands into the Kalamazoo River in Michigan is Enbridge’s largest during this time period, and 42 other incidents were larger than 2,100 gallons (50 barrels).
- Line 3 was also the source of the largest inland oil spill in the U.S. on March 3, 1991 when 40,000 barrels (1,680,000 gallons) spilled in Grand Rapids, Minnesota.
- Incidents have been reported from both old and new pipelines and equipment. Data on the age and cause of failure for these incidents show that new pipelines are not free from harmful incidents. Given the long proposed lifetimes of these projects, new pipelines eventually turn into old ones.
- Alarmingly, 46 Enbridge spills were due to equipment or materials that was installed 10 years or less prior to the incident.
- In the state of Minnesota alone since 2002, seven pipeline operators (including Enbridge, Magellan and Koch Pipelines) have reported 132 hazardous liquids incidents, 17 of which were larger than 2,100 gallons (50 barrels).
- Citing environmental risks and other factors, the Minnesota Department of Commerce concluded that the Line 3 expansion is not in Minnesota’s interest, and that the existing pipeline should cease operations.
- The Line 3 expansion is starkly inconsistent with the goals of the Paris Climate Agreement.
- Ultimately, there is no failsafe method for transporting oil, therefore Minnesota should reject new and expanded oil pipelines and adopt ambitious transition policies to phase out the use of existing fossil fuel infrastructure.

Introduction
The Canadian company Enbridge operates a network of pipelines across many regions of the United States and Canada.[1] A crucial component of their network (called the “Mainline System”) transports crude oil and diluted bitumen (“dilbit”) from Alberta’s tar sands fields across North Dakota, Minnesota, Wisconsin, and Michigan to refineries and other destinations in the midwest.[2] Enbridge is currently proposing to replace and expand one of these pipelines, known as Line 3, to increase the volume of oil it can carry from 390,000 barrels per day (bpd) to 760,000 bpd initially — and potentially to as much 915,000 barrels per day.[3]
The construction of the Line 3 expansion project would facilitate the further expansion of Alberta’s tar sands fields. Oil spills from tar sands pipelines put Indigenous Nations and communities along its path at risk. An Indigenous-led movement has drawn attention to the numerous risks of a new tar sands pipeline and has mobilized large numbers of people to oppose the project, to contest the regulatory process Enbridge needs to begin construction, and to confront the pipeline’s financers.[4]
The proposed Line 3 route crosses territories referenced in the 1855 treaty between the Anishinaabe (Ojibwe) and the U.S. government, where Anishinaabe rights to hunt, fish and gather were upheld by a 1999 Supreme Court decision.[5] As the Indigenous-led organization Honor the Earth puts it: “The proposed Line 3 corridor would violate the treaty rights of the Anishinaabeg by endangering primary areas of hunting, fishing, wild rice, and cultural resources in the 1855 treaty territory. […] Line 3 threatens the culture, way of life, and physical survival of the Ojibwe people.”[6]
The existing Line 3 pipeline runs for over 1,000 miles from Edmonton, Alberta to Superior, Wisconsin. The proposed expansion would deviate from the existing Line 3 route for a substantial section in Minnesota, requiring a new right of way, and would use the existing route for the rest of its length.[7] Once fully expanded, Enbridge’s Mainline system would transport over 3 million barrels per day — a volume of oil equivalent to two Exxon Valdez tankers every day.[8]

Alberta’s tar sands are among the dirtiest and most carbon-intensive fuel sources on the planet, with total lifecycle greenhouse gas emissions more than 30% higher than standard crude oil.[9] However, a lack of pipeline takeaway capacity has hampered investment and confidence in new extraction projects.[10] The Line 3 expansion, along with the Trans Mountain Expansion Project and the Keystone XL pipeline, were proposed to rectify this situation for the oil companies, but the planet can no longer tolerate additional tar sands extraction. Carbon emissions from existing coal, oil, and natural gas projects are already sufficient to breach the goals outlined in the Paris Climate Agreement.[11] Given their high carbon lifecycle emissions and comparatively high breakeven prices, it is clear that expanded tar sands extraction is inconsistent with a healthy global climate.[12]
In June 2017, Minnesota Governor Mark Dayton affirmed the goals of the Paris Agreement, and joined the U.S. Climate Alliance vowing to “uphold the tenets of the Paris Climate Change Agreement in our state.”[13]
Minnesota is already experiencing impacts from a changing climate. Over the past century, Minnesota has gotten warmer and wetter, with more frequent heavy rains and less extreme low temperatures.[14] Warmer winters could fuel the spread of pests, such as the eastern larch beetle, and negatively impact winter recreation and tourism.[15] Summer of 2018 saw a cyanobacteria algal bloom that stretched for 50 miles through the waters of Lake Superior, driven by warmer waters and agricultural runoff.[16] Future warming could bring worsening air quality, more flooding, and threats to agriculture.[17] Even if a longer agricultural growing season could bring economic benefits to the state,[18] by the end of the century “the Minnesota summer climate will generally resemble that of current-day Kansas.”[19]
Enbridge’s Line 3 expansion project carries many of the same financial and reputational risks as the Dakota Access Pipeline, both for the pipeline builder and its financial backers.[20] In 2017, the Minnesota Department of Commerce found that “Enbridge has not established a need for the proposed project in Minnesota,” noting that demand for refined petroleum products would likely stay flat in Minnesota, and that midwestern refineries are already running close to capacity.[21] The Commerce Department also concluded that, given the environmental and socioeconomic risks, “Minnesota would be better off if Enbridge proposed to cease operations of the existing Line 3, without any new pipeline being built.”[22]
Despite the numerous compelling arguments against Line 3, the Minnesota Public Utility Commission has moved to grant Enbridge’s Certificate of Need, although as of this writing there remain several permits, including motions to reconsider, still to be granted before construction can begin.
Enbridge’s History of Oil Spills
Enbridge was founded in 1949 as the Interprovincial Pipe Line Company and built its first pipeline moving crude oil from Regina, Canada south across the border to Superior, Wisconsin. The company was renamed Enbridge in 1998, and in 2017 completed a merger with Spectra Energy, thereby creating the “largest energy infrastructure company in North America.”[23] Enbridge operates over 17,000 miles of crude oil and liquids pipelines – around half of which is located in the U.S. – and has a stake in more than 193,000 miles of natural gas and natural gas liquids (NGL) pipelines.[24]
Enbridge Inc. (ENB) is headquartered in Calgary, Alberta. Its current corporate structure includes a master limited partnership Enbridge Energy Partners L.P. (EEP), a limited liability company Enbridge Energy Management, L.L.C. (EEQ), a general partner Enbridge Energy Company, Inc. in addition to numerous subsidiaries.[25] Three of these entities — ENB, EEP, and EEQ — are traded on the New York Stock Exchange, although recently announced plans could lead to a simplification of this corporate structure.[26] Analysis of regulatory filings shows that Enbridge maintains over $20 billion in credit facilities and “will depend heavily on financing from major investment banks to complete the Line 3 project.”[27]
PHMSA Data on Enbridge Pipeline Spills
Data from the U.S. Pipeline and Hazardous Material Safety Administration (PHMSA) shows that the U.S. portion of the pipeline network owned by Enbridge and its joint ventures and subsidiaries suffered 307 hazardous liquids incidents from 2002 to August 2018 — around one spill every 20 days on average.[28] There is no comparable national data set in Canada or a consistent format for data collection or release. The National Energy Board regulates inter-provincial pipelines and provincial agencies regulate pipelines that don’t cross a provincial boundary.[29]
This report maps these 307 incidents, spread across numerous U.S. states where Enbridge operates.
A map of pipeline incidents reported by Enbridge and its subsidiaries (red) and by all operators in the state of Minnesota (blue). The U.S. hazardous liquid pipelines network (gray) and rivers and streams (aqua) are shown for comparison. Pipelines operated by Enbridge are shown in red except for the existing and proposed Line 3 pipelines routes, which are shown in black.
Of these 307 incidents, 291 were crude oil spills, 9 were refined petroleum product spills, and 7 were highly-volatile liquids (HVL). These incidents led to the release of 66,059 barrels (2.8 million gallons) of hazardous liquids, of which nearly all (66,041 barrels) were crude oil. Of this total, more than 20% (13,410 barrels) was never recovered. Figure 1 shows the timeline of these spills, broken out by the Enbridge corporate entity, joint venture, or subsidiary that reported them.

As can be seen from the figure, Enbridge and its subsidiaries have reported a significant number of incidents every year since 2002. The primary U.S. subsidiary, Enbridge Energy L.P. has reported 173 incidents since 2002, along with significant numbers of spills from Enbridge Pipelines Ozark (39) and the North Dakota Pipeline Company (30). CCPS Transportation, a subsidiary which operates the Spearhead Pipeline, has reported 18 incidents. For Express Holdings (which operates the Express Pipeline) and the Olympic Pipeline (operated by BP, but with a majority stake held by Enbridge from 2005-2017), we only include pipeline spills that occurred when Enbridge held an interest in the pipeline. (For full details on research methods, see Appendix A.)
Enbridge also holds a 27.6% interest in the Bakken Pipeline, which is comprised of the Dakota Access Pipeline (DAPL) and the Energy Transfer Crude Oil Pipeline (ETCO). This report does not include those spills, but they were discussed in depth in a recent report on the spill record of Energy Transfer Partners.[30]
Kalamazoo River Spill and Other Significant Incidents
Forty-three of Enbridge’s spills are considered “significant,” meaning they resulted in more than 50 barrels (2,100 gallons) released.[31] Much of Enbridge’s crude oil spill total comes from one disastrous incident.
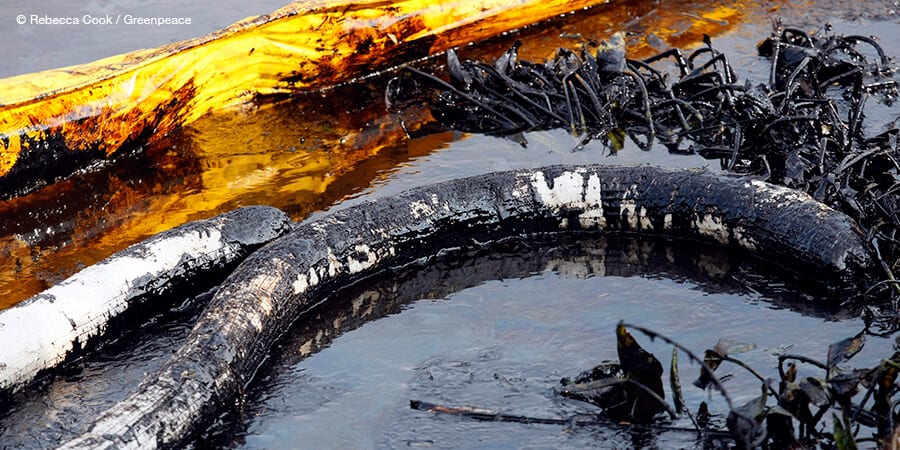
On July 26, 2010, Enbridge’s Line 6B pipeline ruptured, spilling more than 20,000 barrels (840,000 gallons) of diluted bitumen into the Kalamazoo River near the town of Marshall, Michigan.[32] The spill impacted hundreds of families and polluted two miles of Talmadge Creek and 36 miles of the Kalamazoo River, before being contained 80 miles from Lake Michigan.[33] The spilled bitumen sunk to the bottom of the river triggering a years-long, billion dollar clean-up operation that required dredging the river bottom.
Cleaning up oil spills in water is an inherently difficult task. For typical oil spills into water only a fraction of the spilled oil can be recovered by deploying booms and skimmers, or via other methods.[34] Dilbit spills pose an especially difficult clean-up challenge due to the properties of the oil.
A 2015 study by the National Academies identified unique problems associated with a dilbit spill.[35] The dilbit mixture can separate rapidly after a spill, with the lighter volatile diluents evaporating and leaving behind the denser bitumen, which can sink in water. This complicates most oil spill response techniques designed to handle oil floating on the surface.[36]
According to damage estimates prepared by the US Fish and Wildlife Service, in addition to impacts to water, wildlife, the ecosystem, the 2010 Kalamazoo spill led to the loss of approximately 100,000 recreational user-days, impacting activities like fishing, boating, and shoreline and trail use.[37]

In 2016, the U.S. Environmental Protection Agency (EPA) settled with Enbridge for $177 million in connection with the Kalamazoo River spill and another large crude oil spill near Romeoville, IL.[38] The total represented $61 million in Clean Water Act fines, $110 million in spill prevention safeguards, and $5.4 million in recovered government costs. The settlement was the largest Clean Water Act fine for an inland oil spill in U.S. history – and second overall only to BP’s Deepwater Horizon disaster.
The fine comes on top of at least $1.2 billion in disclosed clean-up costs,[39] which included “$551.6 million spent on response personnel and equipment, $227 million on environmental consultants and $429.4 million on professional, regulatory, and other costs.”[40] Enbridge also spent nearly $1 billion reviewing the safety of its pipeline network and another $1.6 billion to replace the entire Line 6B pipeline.[41]
Enbridge was fined again in 2018 for $1.8 million after failing to fully inspect one of its pipeline systems for vulnerabilities including cracks and corrosions, a condition of the 2016 agreement with the EPA following the Kalamazoo spill.[42]
As catastrophic as the Kalamazoo River spill was, it’s not Enbridge’s worst disaster. Although not covered by the data considered in this report as the spill pre-dates 2002, the largest inland oil spill in the U.S. occurred on Enbridge’s Line 3 pipeline itself on March 3, 1991 near Grand Rapids, Minnesota. Over 40,000 barrels (1,680,000 gallons, roughly twice as much oil as spilled in Marshall, Michigan) of crude spilled from the pipeline, which took the company more than an hour to shut down.[43] Some of the oil flowed into the Prairie River. The river was covered at that time by 18 inches of ice, which facilitated cleanup of the spill and fortuitously avoided significant harm to downstream drinking water resources.[44]
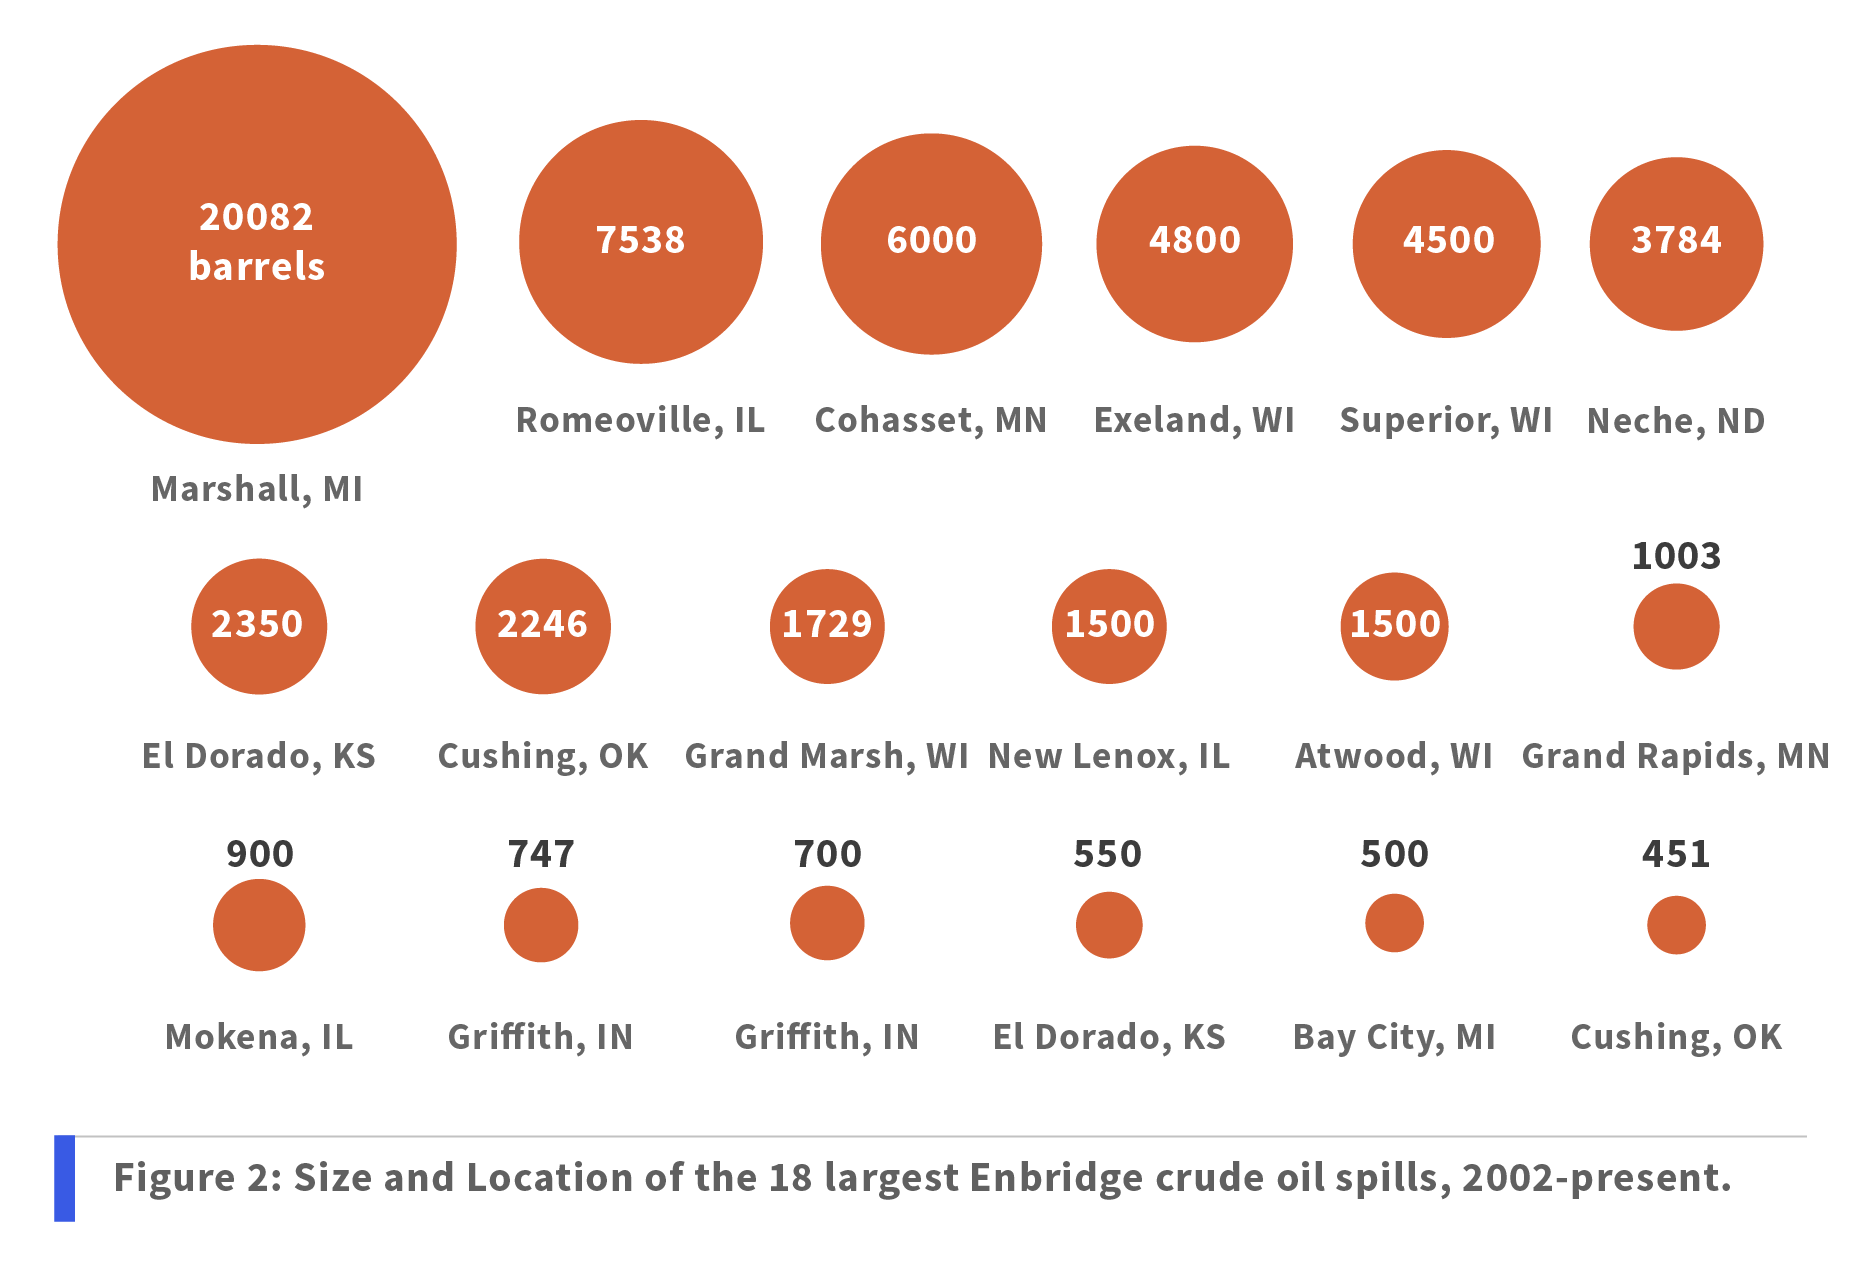
Catastrophic oil spills like those in Marshall and Grand Rapids, pose a warning of the serious risks around expanded tar sands pipelines such as Line 3. But of course, these are not the only large spills that Enbridge’s system has suffered. Figure 2 shows the volume in barrels and location of the 18 largest spills reported by Enbridge and subsidiaries since 2002.
Other significant Enbridge spills include:
- In September 2010, an underground pipeline near Romeoville, Illinois (a suburb of Chicago) leaked for four days, eventually releasing 7,538 barrels (317,000 gallons).[45] According to the accident report, the spilled oil “migrated into nearby storm water and septic sewer systems, and reached both a local stormwater retention pond and water treatment plant.”
- On July 4, 2002, an Enbridge pipeline crossing an “open wetland area” near Cohasset, Minnesota and near the Mississippi River ruptured spilling around 6,000 barrels (252,000 gallons), causing “injury to natural resources.”[46] Fearing that the oil could contaminate the nearby Mississippi River, authorities set a controlled burn that caused a smoke plume that extended for miles.[47]
- On February 2, 2007, Enbridge work crews ruptured a pipeline leading to the release of 4,800 barrels (202,000 gallons) of crude into a construction pit near Exeland, Wisconsin. Regulators warned that the spill had seeped deep enough to potentially contaminate local groundwater.[48]
- On January 24, 2003, 4,500 barrels (189,000 gallons) spilled from an Enbridge pipeline in Superior, Wisconsin. Much of the oil was recovered, but around 19,000 gallons spilled onto the ice-covered Nemadji River.[49]
- On January 8, 2010, 3,748 barrels (157,000 gallons) spilled near Neche, North Dakota.[50]
- On November 28, 2007, two Enbridge workers died in an explosion while making repairs to the Line 3 pipeline near Clearbrook, Minnesota. The accident report indicates that 325 barrels of crude oil were released and then ignited a blaze that took emergency responders 12 hours to extinguish. The incident led to a $2.4 million fine.[51]
- In May 2012, two people were killed and three people were injured after a “two vehicle collision” with an Enbridge pipeline resulted in a 1,500 barrel (63,000 gallon) oil spill and a fire in New Lenox, Illinois.[52]
- On February 19, 2004, Grand Rapids, Minnesota was again the site of an Enbridge spill. This time, maintenance workers found a slow leak of crude oil on the Line 2 pipeline, leading to the release of about 1,003 barrels (42,000 gallons) and affecting groundwater below the leak.[53]
- On July 27, 2012, 1,729 barrels (73,000 gallons) spilled from Line 14 near Grand Marsh, Wisconsin. A local resident stated that the pipeline “blew like an oil well” and sprayed oil a distance of 1000 feet across a plot of grass used as pasture for livestock. This follows a similar 1,500 barrel (63,000 gallon) spill on the same line on January 1, 2007 in Atwood, Wisconsin. Both incidents were due to pipe seam failures dating from the line’s 1998 construction, a problem that had previous been identified by inspectors during the construction phase.[54]
Impacts on Water, Wildlife, Economy
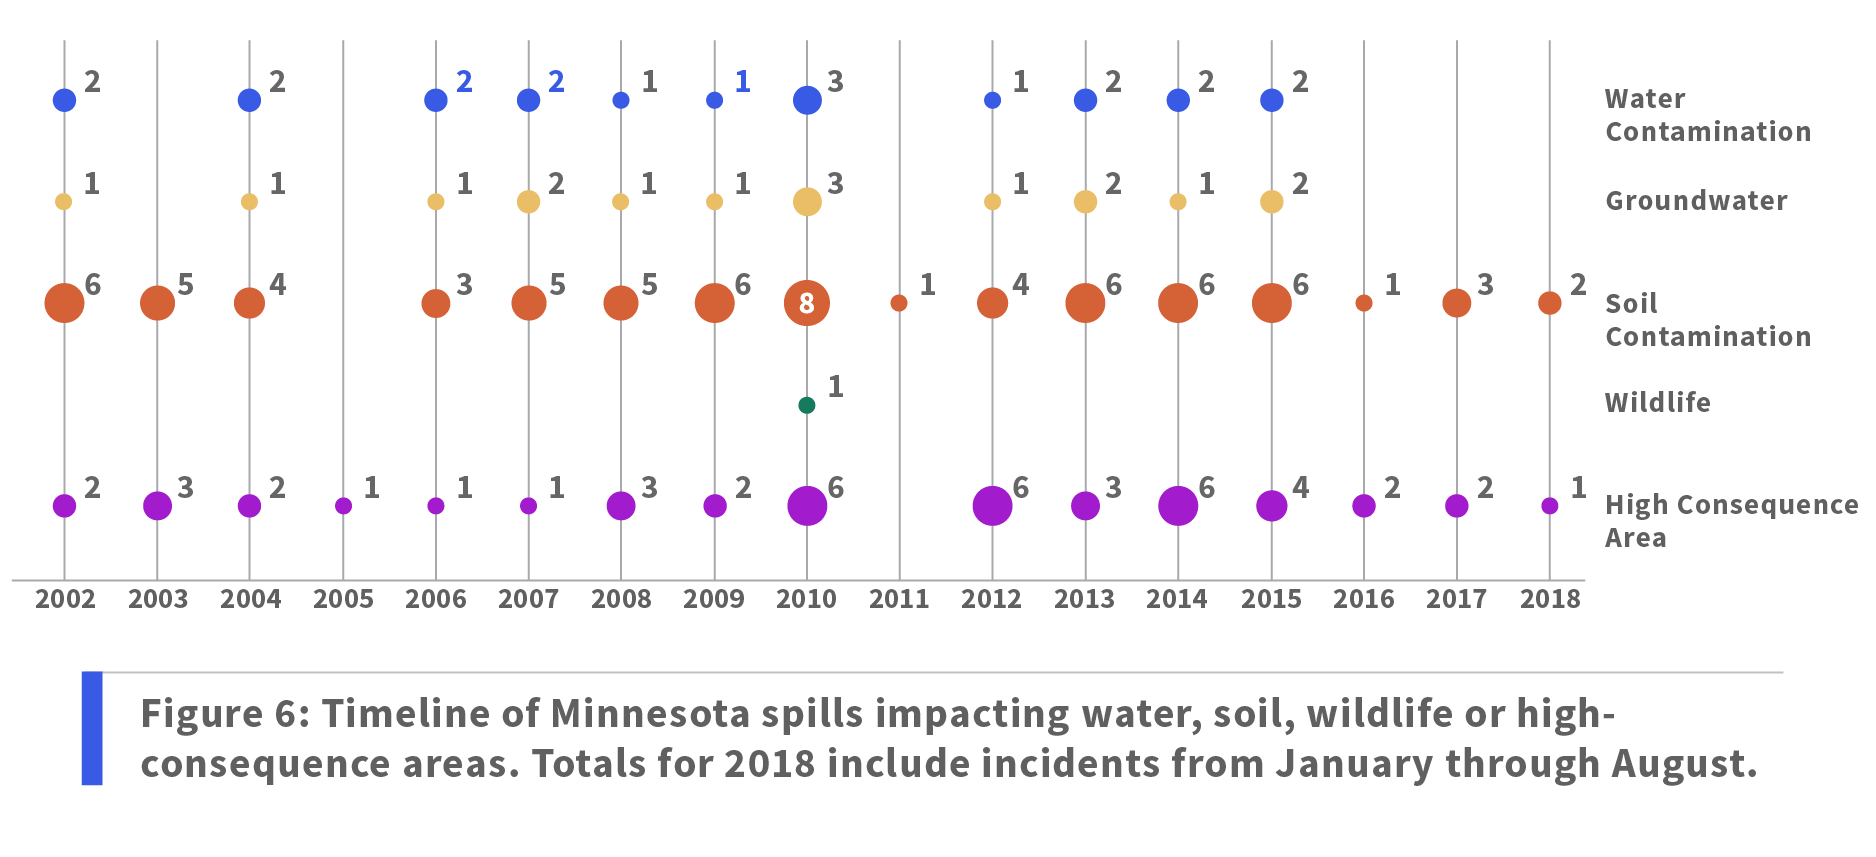
Since 2002, Enbridge spills have caused nearly $1 billion ($986,645,819 to be specific) in reported property damage,[55] with the vast majority of that coming from the Kalamazoo River spill. However, 18 other spills led to reported property damages greater than $1 million, including the spills in Romeoville, Cohasset, and Exeland mentioned previously. Thirty Enbridge spills contaminated water resources, including 17 that contaminated groundwater, and 6 Enbridge spills were reported to impact wildlife. Figure 3 shows a timeline of Enbridge spills impacting water, soil, and wildlife resources, as well as spills that impacted “high-consequence areas” (HCAs).
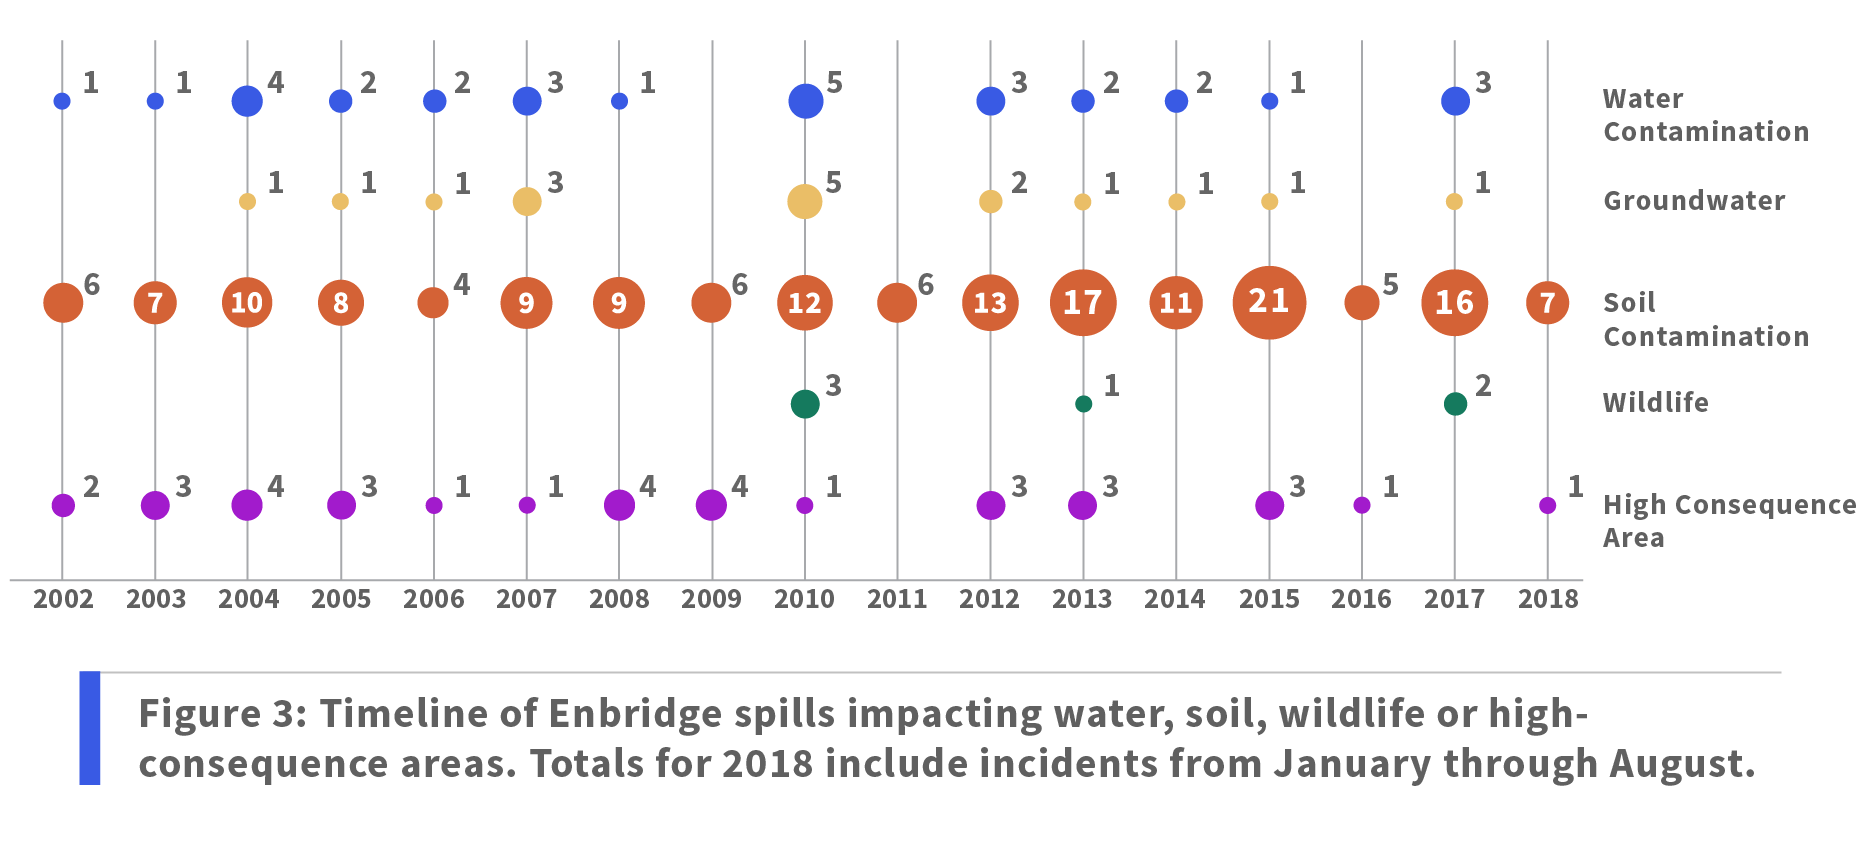
High-consequence areas include areas with human populations, drinking water, ecological resources, or commercially navigable waterways. Pipeline operators must comply with additional safety regulations in these areas.[56] In 2017, Enbridge and its subsidiaries collectively reported around 4,300 miles of pipelines traversing high-consequence areas in the U.S.[57]
Violations
Enforcement records dating back to 2006 show that PHMSA has fined Enbridge and its subsidiaries around $6.6 million.[58] A separate database of U.S. federal enforcement actions contains a total of 45 penalty records for Enbridge totalling over $248 million in fines since 2010. The majority of these (32) were violations of environmental regulations, but the total also includes workplace and other safety violations, including a $2.4 million fine due to the 2007 oil spill where two Enbridge employees lost their lives.[59]
In January 2009, Enbridge settled a lawsuit brought by the state of Wisconsin for $1.1 million. The suit alleged numerous permit violations “resulting in impacts to wetlands and navigable waterways” in the course of its construction of the Alberta Clipper pipeline in 2007 and 2008.[60]
Pipelines, Old and New
Serious concerns have been raised about the integrity of the aging Line 3 pipeline, noting widespread corrosion problems and inadequate pipeline coating and welding techniques.[61] Enbridge’s nearby Line 5 pipeline has spilled over one million gallons in its 64-year history.[62] Concerns about the existing Line 3 pipe were also echoed by the Minnesota PUC as a reason to move ahead with Enbridge’s replacement and expansion plan.[63] It is undoubtedly true that aging pipelines pose serious risks, but new pipelines are not risk free, and given the long proposed lifetimes of these projects, new pipes eventually turn into old ones.
Enbridge provides data to PHMSA on the age of its pipeline network, reporting the number of miles of pipeline that were installed in each previous decade.[64] PHMSA’s incident data also reports information on the cause of each incident and the “item involved in the accident, ” meaning the pipes, welds, valves, tanks, or other equipment whose failure led to the spill. This data also includes the year that the item in question was installed.[65] Figure 4 combines these data sets showing the mileage of Enbridge pipelines by decade installed and the installation decade for the “item involved” in Enbridge’s pipeline spills.[66]
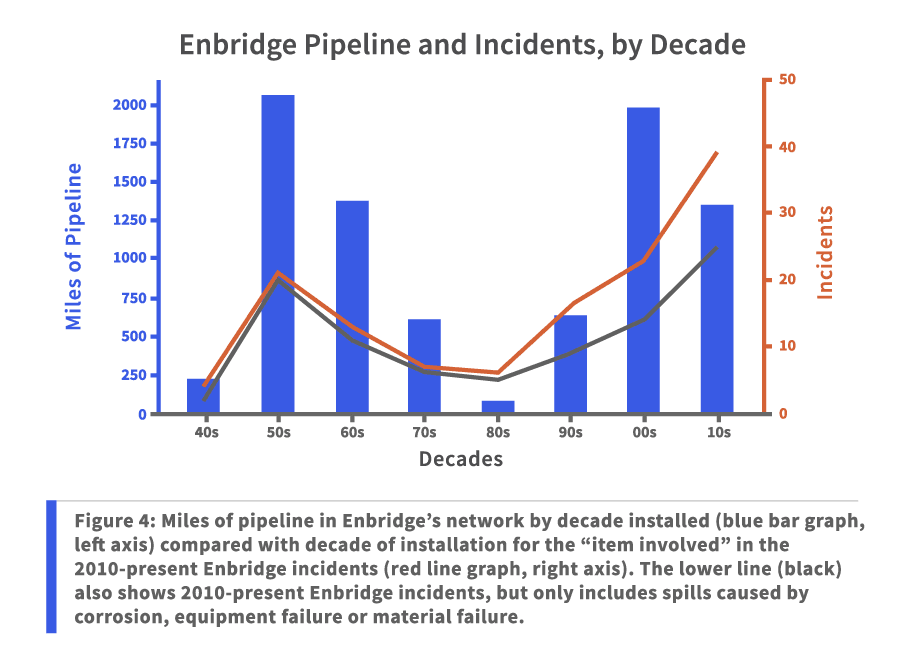
Enbridge’s U.S. pipeline network contains both new pipelines as well as a significant fraction of pipe installed in the 1950s and 60s. Of the 307 Enbridge incidents, 138 were attributed to equipment failure, 43 to corrosion failure, and 45 to material failure of a pipe or weld. Of the remainder, 37 were due to incorrect operation, 26 to natural force damage, and 18 to other causes including excavation damage.
Figure 4 also shows that Enbridge’s pipeline incidents are due both to recently installed equipment, as well as to older legacy equipment. This is true considering both Enbridge incidents from all causes (Figure 4, red line), and when excluding incidents due to “external” causes (black line, showing only incidents due to corrosion, equipment failure and material failure). In general, according to this data, spills due to recently installed equipment are more likely to be due to equipment failure, while spills due to corrosion failure are more likely to be older pipes.
Considering the difference between the year of the spill and the item installation year, we find that 73 Enbridge spills were due to equipment that was installed 10 years or fewer prior to the incident. Those 73 spills released a total of 9,676 barrels, and 12 of them were more than 50 barrels. Again, excluding spills with external causes, Enbridge reports 46 incidents due to equipment that was installed 10 years or fewer prior to the incident, releasing a total of 2,310 barrels.
Among all U.S. pipeline operators, there are a number of incidents where recently installed equipment failed resulting in very large spills. One notable recent spill is the November 16, 2017 incident on TransCanada’s Keystone 1 pipeline that spilled 9,726 barrels in Marshall County, South Dakota.[67] A metallurgical analysis concluded the spill was caused by “a fatigue crack, likely originating from mechanical damage to the pipe exterior” when it was installed in 2008.[68] Other relevant spills include a 2017 Enterprise spill of 1,015 barrels due to internal corrosion in a pipe installed in 2012, and a 2016 Sunoco spill of 8,600 barrels due to external corrosion in a pipe installed in 2015.
From 2007 to 2016, U.S. crude oil pipelines have averaged 0.001 significant incidents and 0.57 barrels spilled per year per mile of pipeline. Assuming that average would hold for the 1,031 mile Line 3 Expansion pipeline, we would expect the pipeline to average around one significant spill per year, or around 51 such spills over a nominal 50 year lifetime.[69]
This analysis indicates that not only does Enbridge continue to have lingering issues with its old and aging pipeline network, as the company itself has identified, but that newly installed pipelines and equipment are still vulnerable to spills and safety concerns. Age of the pipeline cannot therefore be the only consideration when assessing pipeline safety.
Minnesota’s History of Oil Spills
While Enbridge has experienced numerous significant spills in recent years, they are not the only problematic pipeline operator in Minnesota. The cumulative impact of spills from pipelines and corresponding risks to water, communities, and commerce must be evaluated beyond the scope of a single company.
PHMSA Data on Minnesota Pipeline Spills
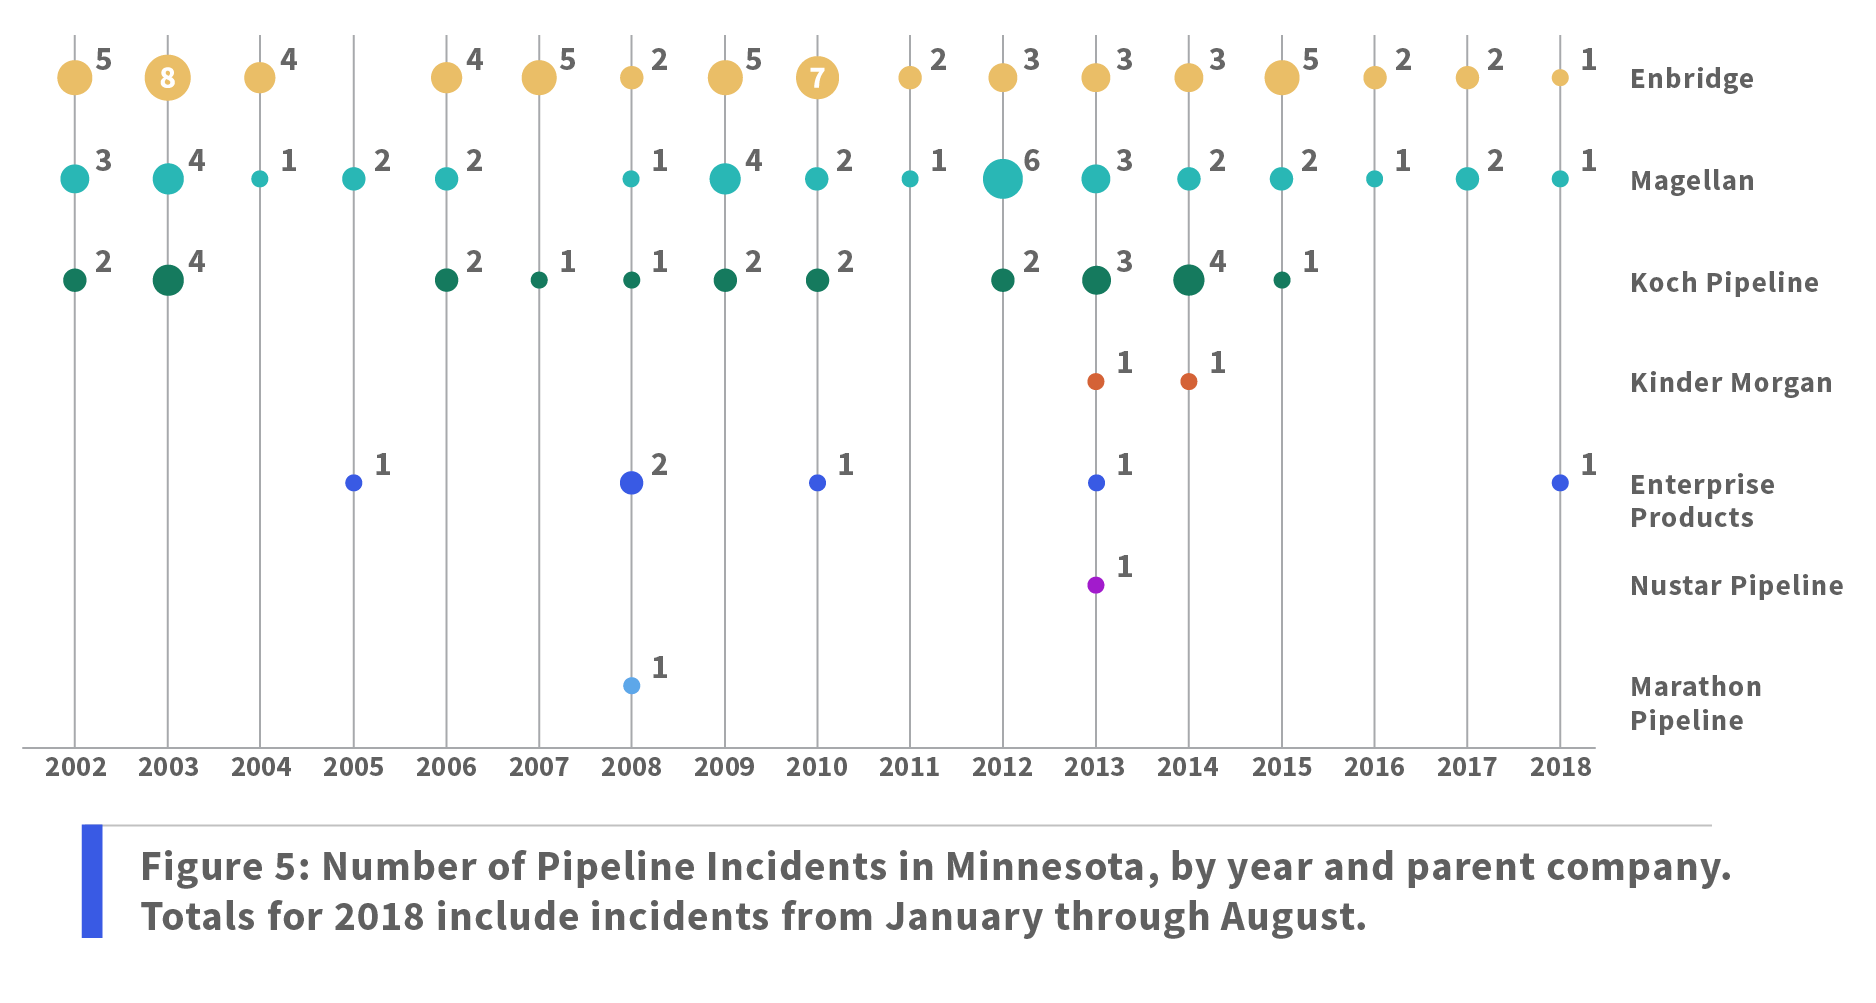
In the state of Minnesota, the PHMSA dataset finds 132 incidents from 2002 to present, of which 85 were crude oil spills, 37 were refined petroleum product spills, and 10 were HVL spills. These spills released a total of 25,879 barrels. Since 2002 in Minnesota there have been 17 significant spills over 50 barrels, and seven spills over 1,000 barrels:
- The Enbridge spills in Cohasset, MN and Grand Rapids, MN, described above.
- A 2006 spill by Koch Pipelines that released 3,200 barrels of crude oil in Little Falls, MN.
- A 2008 spill by Koch Pipelines that released 1,600 barrels of crude oil in Clearbrook, MN.
- A 2009 spill by Koch Pipelines that released 5,000 barrels of crude oil in Staples, MN.
- A 2011 spill by Enterprise Products Partners that released 4,544 barrels of HVL in Trimont, MN
- A 2012 spill by Magellan Pipeline Company that released 1,477 barrels of refined product in Apple Valley, MN.
The companies which reported these 132 incidents are as follows:
As Figure 5 shows, Minnesota experienced 3 spills in 2016, 4 in 2017, and three so far in 2018.
Impacts on Minnesota’s Water, Wildlife, Economy
Since 2002, Minnesota’s 132 spills caused $37,884,541 in damages, with 11 spills causing over $1 million in damages a piece. 20 spills contaminated water resources, of which 16 contaminated groundwater. One Enbridge spill was reported to have impacted wildlife.
The Environmental Impact Statement for Line 3 compiles a number of metrics to assess the threat to Minnesota’s water resources from continued and expanded tar sands oil shipments through the state. The Line 3 proposed route would require 227 surface water crossings, including 46 waters designated by the states for beneficial uses and water quality, and seven navigable river crossings.[77] Minnesota’s natural wild rice fields, representing an “important social and cultural component for American Indian tribes and rural Minnesota communities”[78] could be threatened by a pipeline spill.
In Minnesota, the project would cross 25,765 acres of high vulnerability water table aquifers, 26,382 acres of high groundwater contamination susceptibility, and 16,299 acres of high pollution sensitivity.[79] The EIS identifies 618 domestic wells within 2,500 feet of the proposed pipeline route, and 146 domestic wells within a 10-mile-long region of interest downstream from water crossings.[80] Wellhead protection areas covering 189.7 acres were found within 2,500 feet of the route, and areas covering 130 acres within the 10-mile-long downstream region.[81] Twenty public water supply wells were found within 2,500 feet of the pipeline.[82]
Despite these risks, federally-approved oil spill response plans are not typically fully available to the public,[83] and the public should have access to more information regarding spill response capabilities in vulnerable regions along the path, including the Duluth-Superior harbor, various river crossings, and the Mississippi River headwaters. A separate lawsuit alleges that the U.S. Coast Guard contingency plan for Northern Michigan does not adequately prepare for clean-up of a worst case discharge into the Great Lakes.[84] Concerns were also raised in the EIS about pinhole leaks that would not immediately trigger Enbridge’s leak detection systems, but would release large volumes of oil over time.[85]
It is worth noting that many of the considered alternatives to the Line 3 expansion considered in the EIS scored even worse on water protection metrics. This illustrates that the best way to protect the waters of Minnesota is to reduce oil consumption and rapidly transition toward clean energy.

Pipelines in a 1.5°C World
The expanded Line 3 pipeline would transport large volumes of crude oil and tar sands for decades to come, and the carbon emissions from extracting, processing, transporting, and burning that oil would contribute to global climate change at a time when we need to rapidly reduce emissions. An analysis of the social cost of carbon due to emissions from Line 3 oil over the next 60 years found a range of social costs from $330 billion to over $1 trillion. Those costs will be paid through lost agricultural productivity, impacts to human health, sea-level rise and increased flood risk, among other costs.[86]
Existing global fossil fuel resources are more than enough to drive global warming past safe levels. In particular, the established goal of limiting warming to 1.5°C (as detailed in the recent IPCC Special Report[87] and as referenced in the Paris Climate Agreement) provides significant constraints on how much and which resources can be burned. This temperature limit implies a “carbon budget” — a limit on the total amount of carbon that can be emitted to the atmosphere.[88] Translating this global constraint to the level of individual extraction projects is a complex interaction between financial forces and global and local politics. However, in the case of new tar sands pipelines, the conclusion is clear.
A series of reports by the Carbon Tracker Initiative (CTI) has analyzed the carbon budget in terms of a “breakeven price” for various fossil fuel extraction projects. CTI’s assumption is that, all else being equal, we will choose to develop the cheapest and most economic fossil fuel resources consistent with our carbon budget, and leave the most expensive resources in the ground. Using project-level data, CTI ranks all fossil fuel projects by increasing breakeven price and carbon content, and excludes projects above cutoff prices associated with various carbon budget limits.[89]
Using this methodology, CTI concludes that “no investment in new greenfield oil sands projects is required before 2025”[90] in either the International Energy Agency (IEA) Sustainable Development Scenario (SDS, roughly consistent with 2°C of warming)[91] or its Beyond Two Degrees Scenario (B2DS).[92] We note that neither the SDS or B2DS scenario are truly “Paris compliant” since neither limit warming to 1.5°C with a high level of probability, and both rely heavily on unproven technologies such as carbon capture and sequestration (CCS).[93] The recently published Low Energy Demand (LED) scenario shows that a true 1.5°C scenario with no CCS will require even steeper reductions in oil demand (see Figure 7).[94]
Despite the weaknesses of the IEA’s scenarios, the CTI finding places a strong constraint on new tar sands extraction; projects that are not consistent with SDS or B2DS will also not be required under a truly Paris compliant scenario.
A report by Oil Change International provides a different metric for dividing up the global carbon budget. That report finds that the carbon reserves in currently operating oil and gas fields are themselves sufficient to increase warming beyond 1.5°C, and currently operating coal, oil and gas projects would push warming beyond 2°C.[95] The report notes that “least-cost” strategies (such as CTI’s analyses) for identifying which extraction projects should be prohibited may not fully account for political realities, and instead calls for “no new fossil fuel extraction or transportation infrastructure” irrespective of breakeven price.
According to either methodology, the conclusion is the same: the tar sands cannot expand further if we are to have a chance at a safe climate. Yet proposed tar sands pipelines could well be the catalyst for further extraction. Existing tar sands projects have saturated existing pipeline capacity,[96] and for a range of oil prices, the construction of new pipeline takeaway capacity would be the factor that makes those new extraction projects economic.[97] As a result, new tar sands pipelines such as Line 3, Trans Mountain or Keystone XL are clearly inconsistent with the Paris Climate goals and the 1.5°C target.
Global and regional energy model scenarios also provide useful information about how rapidly fossil fuel use needs to ramp down consistent with climate goals. Figure 7 shows total primary energy demand from oil for a number of different energy models; a common feature among models limiting warming to 2°C or 1.5°C is that global oil demand peaks soon and is followed by a rapid decline toward the second half of the century – spanning the economic lifetime of new oil pipelines.

This basic pattern is reflected in projected U.S. oil demand as well. Figure 8 shows IEA’s estimates for total primary energy from oil for the United States out to the year 2040 in four scenarios, breaking out oil use by final sector (transport, buildings, industry, and other[100]) for two of the models. The IEA finds that most of the reductions in oil demand in the SDS model come in the transport sector. The Minnesota Department of Commerce found that Minnesota’s demand for refined petroleum products was “unlikely to increase in the long term,”[101] which is broadly consistent with IEA’s Current Policies (CPS) and New Policies Scenarios (NPS), but climate safe scenarios will require strong reductions. IEA’s strongest, but still inadequate, scenario (B2DS) requires a ~60% reduction in U.S. oil demand from 2016 levels by the year 2040.

Meeting these reductions in oil demand will require profound changes in global energy trends, investment, infrastructure, and political culture. But investing in new pipeline infrastructure now will make it harder to meet those goals in the near future. Pipelines incur large upfront construction costs with an eye towards recouping those costs and making a profit over the long (50-60 year) lifetime of the pipe. This dynamic increases the risk that investing in pipelines now could “lock-in” extraction and high levels of emissions far into the future.[102]
Conclusions
There is a false narrative that the only way to protect Minnesotans from a pipeline spill is to replace the existing Line 3 with a new pipeline. The evidence shows that while old pipelines are indeed risky, new pipelines also spill. Allowing Enbridge to expand Line 3 across Minnesota would inevitably lead to spills and greater carbon emissions, putting Minnesotans at risk.
There is no failsafe method to transport oil and the planet can no longer afford to recklessly expand fossil fuel infrastructure with no regard for the long-term, cumulative impacts to water, communities, commerce, the environment, and our shared climate. The truth is that there is no room for Enbridge’s expanded Line 3 pipeline in a Paris-compliant world, and indeed, increasing momentum toward electric vehicles and other clean transportation options could lead oil demand to peak and fall sooner than oil companies would like.
The time is ripe for real climate leadership to show the way forward. No new fossil fuel infrastructure should be permitted and an ambitious plans must be developed to phase out risky, existing infrastructure and secure a just transition for all.

Acknowledgments
Greenpeace USA is grateful to the following organizations for endorsing this report, and for their continued action in defense of water and the communities that depend on it. We are grateful to Paul Blackburn of Honor the Earth and Akilah Sanders-Reed of the Powershift Network for their thoughtful comments on a draft of this report.
Endorsing Partners:
Honor the Earth
Women’s Earth and Climate Action Network (WECAN)
Powershift Network
Rainforest Action Network
Sierra Club
MN350
Friends of the Headwaters
Waterkeeper Alliance
Appendix: Research Methods
Endnotes
1. Enbridge. Infrastructure Map. http://www.enbridge.com/map#map:infrastructure
2. Enbridge. Pipeline System Configuration, Q1, 2018. http://www.enbridge.com/~/media/Enb/Documents/Infographics/ENB%20Mainline%20Pipeline%20System.pdf
3. Enbridge Energy, Limited Partnership. 2015. Certificate of Need Application. April. https://mn.gov/eera/web/file-list/4607/
4. Stop the Line 3 Pipeline. https://www.stopline3.org/
5. Minnesota v. Mile Lacs Bank of Chippewa Indians. 1999. 526 U.S. 172
6. Honor the Earth. Enbridge Line 3 Pipeline: What You Need To Know. https://d3n8a8pro7vhmx.cloudfront.net/honorearth/pages/2329/attachments/original/1481597789/factsheet-LINE-3.pdf?1481597789
7. Minnesota Public Utility Commission. 2018. Staff Briefing Papers. https://minnesotapuc.legistar.com/LegislationDetail.aspx?ID=2352236&GUID=2B25FF39-6A29-4445-B0B7-583F7BEB11E9 See map p. 12.
8. National Energy Board. Canada’s Pipeline Transportation System 2016: Enbridge Pipelines Inc.’s Enbridge Mainline. http://www.neb-one.gc.ca/nrg/ntgrtd/trnsprttn/2016/grp1cmpns/lndlqds/nbrdg-ppln-nc-nbrdg-mnln-eng.html
9. Carnegie Endowment. Oil-Climate Index. Viewing Total Emissions. http://oci.carnegieendowment.org/#total-emissions. For example, comparing Canada Cold Lake CSS Dilbit against Saudi Arabia Ghawar oil.
10. Scott, A. & G. Muttitt. 2017. Climate on the Line: Why new tar sands pipelines are incompatible with the Paris goals. Oil Change International. January. http://priceofoil.org/content/uploads/2017/01/climate_on_the_line_FINAL-OCI.pdf
11. Muttitt, G. 2016. The Sky’s Limit: Why The Paris Climate Goals Require a Managed Decline of Fossil Fuel Production. Oil Change International. September. http://priceofoil.org/content/uploads/2016/09/OCI_the_skys_limit_2016_FINAL_2.pdf
12. Scott & Muttitt 2017; Carbon Tracker Initiative. 2018. Mind the gap: the $1.6 trillion energy transition risk. March. https://www.carbontracker.org/reports/mind-the-gap/
13. CBS Minnesota. 2017. Minnesota Joins State Alliance To Uphold Paris Accord. June 5. https://minnesota.cbslocal.com/2017/06/05/minnesota-joins-state-alliance-to-uphold-paris-accord/
14. Minnesota Department of Natural Resources. Climate Changes in Minnesota. https://www.dnr.state.mn.us/climate/climate_change_info/climate-changes-minnesota.html
15. Minnesota Department of Natural Resources. Impacts of Climate Change. https://www.dnr.state.mn.us/climate/climate_change_info/%20impacts-climate-change.html
16. Hauser, C. 2018. Algae Bloom in Lake Superior Raises Worries on Climate Change and Tourism. New York Times, August 29. https://www.nytimes.com/2018/08/29/science/lake-superior-algae-toxic.html
17. Union of Concerned Scientists. 2009. Confronting Climate Change in the U.S. Midwest: Minnesota. July. https://www.ucsusa.org/sites/default/files/legacy/assets/documents/global_warming/climate-change-minnesota.pdf
18. Kaul, G. 2017. For some Minnesota counties, climate change may bring economic benefits. MinnPost, September 14. https://www.minnpost.com/environment/2017/09/some-minnesota-counties-climate-change-may-bring-economic-benefits/
19. Union of Concerned Scientists. 2003. Confronting Climate Change in the Great Lakes Region: Impacts on Minnesota Communities and Ecosystems. https://www.ucsusa.org/sites/default/files/legacy/assets/documents/global_warming/ucssummarymnfinal.pdf
20. Greenpeace & Oil Change International. 2017. In The Pipeline: Risks for the Funders of Tar Sands Pipelines. October. https://www.greenpeace.org/usa/research/in-the-pipeline-risks-for-funders-of-tar-sands-pipelines/
21. Minnesota Commerce Department. 2017. After extensive review, Minnesota Commerce Department releases expert analysis and recommendation on the certificate of need for Enbridge’s proposed Line 3 oil pipeline project. September 11. https://mn.gov/commerce/media/news/?id=310848 Graeber, D. 2017. No need for Enbridge pipeline overhaul, Minnesota department finds. UPI, September 12. https://www.upi.com/Noneed-for-Enbridge-pipeline-overhaul-Minnesota-departmentfinds/9631505211584/
22. Minnesota Commerce Department 2017.
23. Enbridge. Our History. http://www.enbridge.com/about-us/our-history
24. Enbridge. Who we are. http://www.enbridge.com/about-us/our-company
25. Enbridge. Ownership Structure. http://www.enbridgepartners.com/Investor-Relations/EEP/Common-Unit-Information/Ownership-Structure.aspx
26. Enbridge. 2018. Enbridge Announces Definitive Agreements to Acquire All Public Equity of Enbridge Energy Partners and Enbridge Energy Management, Achieves Significant Milestones Toward Corporate Structure Simplification. September 18. http://www.enbridge.com/media-center/news/details?id=123529&lang=en
27. Williams-Derry. C. 2018. How Enbridge’s Bankers Fund a Tar Sands Pipeline. Sightline Institute. https://sightline-wpengine.netdna-ssl.com/wp-content/uploads/2018/09/Enbridge-Line-3-Financing-Sightline-09-2018.pdf
28. See also Donaghy, T. & K. Stewart. 2017. Four Proposed Tar Sands Oil Pipelines Pose A Threat To Water Resources. Greenpeace, August. https://www.greenpeace.org/usa/wp-content/uploads/2017/08/TarSandsPipelineSpillReport.pdf This report updates Enbridge spill information previously shared in the 2017 report. The latest PHMSA data also includes a total of 15 incidents from TransCanada and 472 from Kinder Morgan, from 2002 to present.
29. Hildebrandt, A. 2013. Pipeline safety: Canada lags U.S. on making data public. CBC, October 29. https://www.cbc.ca/news/canada/pipeline-safety-canada-lags-u-s-on-making-datapublic-1.2254793
30. Donaghy, T. & D. Lisenby. 2018. Oil and Water: ETP & Sunoco’s History of Pipeline Spills. Greenpeace USA & Waterkeeper Alliance, April. https://www.greenpeace.org/usa/reports/oil-and-water/
31. An incident is considered “significant” by PHMSA if it involved a fatality, a hospitalized injury, $50,000 or more in costs, more than 50 barrels (or >5 barrels of HVL) spilled, or resulted in an unintentional fire or explosion.
32. McGowan, E. & L. Song. 2011. The Dilbit Disaster: Inside The Biggest Oil Spill You’ve Never Heard Of. InsideClimate News, June 26. https://insideclimatenews.org/news/20120626/dilbit-diluted-bitumen-enbridge-kalamazoo-river-marshall-michigan-oil-spill-6b-pipeline-epa
33. Associated Press. 2010. Crews Race to Keep Oil Spill from Lake Michigan. July 29. https://www.cbsnews.com/news/crews-race-to-keep-oil-spill-from-lake-michigan/
34. Lubchenco, J. 2009. Letter to Ms. S. Elizabeth Birnbaum, Director, Minerals Management Service. September 21.
35. National Academies of Science, Engineering & Medicine. 2016. Spills of Diluted Bitumen from Pipelines: A Comparative Study of Environmental Fate, Effects, and Response. https://www.nap.edu/catalog/21834/spills-of-diluted-bitumen-from-pipelines-a-comparative-study-of
36. Hirji, Z. 2015. Unique Hazards of Tar Sands Oil Spills Confirmed by National Academies of Sciences. InsideClimate News, December 9. https://insideclimatenews.org/news/09122015/unique-hazards-tar-sands-oil-spills-dilbit-diluted-bitumen-confirmed-national-academies-of-science-kalamazoo-river-enbridge
37. U.S. Fish and Wildlife Service. 2015. Draft Damage Assessment and Restoration Plan/ Environmental Assessment for the July 25-26, 2010 Enbridge Line 6B Oil Discharges near Marshall, MI. May. https://www.fws.gov/midwest/es/ec/nrda/MichiganEnbridge/pdf/EnbridgeNRDADraftDARP_EAMay2015.pdf
38. Hasemyer, D. 2016. Enbridge’s Kalamazoo Spill Saga Ends in $177 Million Settlement. InsideClimate News. July 20. https://insideclimatenews.org/news/20072016/enbridge-saga-end-department-justice-fine-epa-kalamazoo-river-michigan-dilbit-spill
39. Enbridge Energy Partners, LP. 2014. Form 10-Q. November 3. https://www.sec.gov/Archives/edgar/data/880285/000119312514392310/d811068d10q.htm
40. Ellison, G. 2016. New price tag for Kalamazoo River oil spill cleanup: Enbridge says $1.21 billion. MLive. May 20. https://www.mlive.com/news/grand-rapids/index.ssf/2014/11/2010_oil_spill_cost_enbridge_1.html
41. Hasemyer 2016.
42. Hasemyer, D. 2018. Enbridge Fined for Failing to Fully Inspect Pipeline After Kalamazoo Oil Spill. InsideClimate News. May 3. https://insideclimatenews.org/news/03052018/enbridge-fined-tar-sands-oil-pipeline-inspections-kalamazoo-michigan-dilbit-spill
43. Lakehead Pipeline Company, Grand Rapids, Minnesota, 1991-Mar-03. NOAA Incident News. https://incidentnews.noaa.gov/incident/6793
44. Laduke, W. 2017. Happy Anniversary: The largest inland oil spill in U.S. history happened in Minnesota. Grand Rapids Herald Review. http://www.grandrapidsmn.com/opinion/happy-anniversary-the-largest-inland-oil-spill-in-u-s/article_2ade2706-004f-11e7-9023-2b31a01741a6.html
45. Lydersen, K. 2010. Nearby Oil Spill Highlights Hazards in Area’s Pipelines. New York Times, September 16. https://www.nytimes.com/2010/09/17/us/17cncoilspill.html
46. U.S. Fish & Wildlife Service. 2005. Draft Restoration Plan and Environmental Assessment for the July 4, 2002 Enbridge Energy, Limited Partnership Oil Spill Near Cohasset, Minnesota. August. https://www.fws.gov/midwest/twincities/enbridge.htm
47. U.S. National Transportation Safety Board. 2004. Rupture of Enbridge Pipeline and Release of Crude Oil near Cohasset, Minnesota July 4, 2002. https://www.ntsb.gov/investigations/AccidentReports/Reports/PAR0401.pdf
48. Associated Press. 2007. Exeland / Oil spill may have tainted groundwater. February 16. https://www.twincities.com/2007/02/16/exeland-oil-spill-may-have-tainted-groundwater/
49. Huron Daily Tribune. 2003. Oil Spills Into Lake Superior Tributary. January 25. https://www.michigansthumb.com/news/article/Oil-Spills-Into-Lake-Superior-Tributary-7328575.php
50. Grand Forks Herald. 2010. Pipeline crews cleaning up oil leak near Neche, N.D. January 11. http://www.grandforksherald.com/news/2117192-pipeline-crews-cleaning-oil-leak-near-neche-nd
51. Myers, J. 2010. Enbridge must pay $2.4 million for fatal explosion. Duluth News Tribune, August 18. http://www.duluthnewstribune.com/business/2300949-enbridge-must-pay-24-million-fatal-explosion
52. Reuters. 2012. Enbridge Pipeline: Oil Leak And Fire Follow Deadly Vehicle Accident. March 4. https://www.huffingtonpost.com/2012/03/04/enbridge-pipeline-oil-leak_n_1319624.html
53. PHMSA. 2010. Summary Incident Report, Enbridge Energy Partners L.P. (Op ID 11169), Deer River, MN to Floodwood, MN (Unit 3083), Line 2 Crude Oil Leak, February 19, 2004. http://pstrust.org/wp-content/uploads/2013/05/Enbridge_HL_MN_2004-02-19_508.pdf
54. Hasmyer, D. 2012. Witness Says Enbridge’s Wisconsin Pipeline ‘Blew Like an Oil Well.’ InsideClimate News, August 1. https://insideclimatenews.org/news/20120801/enbridge-oil-pipeline-wisconsin-phmsa-epa-water-fine-kalamazoo-dilbit-diluted-bitumen-safety
55. PHMSA. 2011. Instructions for Form PHMSA F 7000-1 (Rev 10-2011). Accident Report – Hazardous Liquid Pipeline System. https://www.phmsa.dot.gov/sites/phmsa.dot.gov/files/docs/forms/12436/hlaccidentinstructionsphmsa-f-7000-1on-or-after-january-1-2010_0.pdf. PHMSA defines property damage to include “costs due to property damage to the operator’s facilities and to the property of others, commodity lost, facility repair and replacement, and environmental cleanup and damage.”
56. PHMSA. Hazardous Liquid Integrity Management (HL IM). https://www.phmsa.dot.gov/pipeline/hazardous-liquid-integrity-management/hazardous-liquid-integrity-management-hl-im
57. PHMSA. 2017 Annual Reports. See Appendix A for details on this calculation.
58. See Appendix A for details on this calculation.
59. Violation Tracker. Parent Company Summary: Enbridge. https://violationtracker.goodjobsfirst.org/prog.php?parent=enbridge
60. Wisconsin Department of Justice. 2009. Enbridge Energy Settles State Lawsuit Over Environmental Violations For $1,100,000. January 2. https://www.doj.state.wi.us/news-releases/enbridge-energy-settles-state-lawsuit-over-environmental-violations-1100000
61. Honor the Earth. Line 3 Integrity: What You Need To Know. https://static1.squarespace.com/static/58a3c10abebafb5c4b3293ac/t/58b315eef5e23159700c28cd/1488131568280/Integrity+factsheet.pdf
62. Shankman, S. 2017. Spills on Aging Enbridge Pipeline Have Topped 1 Million Gallons, Report Says. InsideClimate News, April 26. https://insideclimatenews.org/news/25042017/enbridge-pipeline-mackinac-line-5-michigan-oil-spill-risk
63. Dunbar, E. 2018. PUC backs Enbridge Line 3 oil pipeline, sets route. MPR News, June 28. https://www.mprnews.org/story/2018/06/28/enbridge-line-3-minnesota-support-public-utilities-commission
64. Pipeline mileage by decade is taken from the 2017 Annual Reports submitted to PHMSA by Enbridge and its subsidiaries. https://www.phmsa.dot.gov/data-and-statistics/pipeline/gas-distribution-gas-gathering-gas-transmission-hazardous-liquids
65. Out of Enbridge’s 307 spills, an installation year for the “item involved” was provided for 192 incidents, but those incidents accounted for >99% of the spilled volume.
66. Installation year for the “item involved” is taken from PHMSA’s 2010-present incident database. To avoid confusion in interpreting results by decade, Figure 4 only shows spills from 2010 to present. Note that pipeline incidents are caused not just by pipe failures, but also by the failures of valves, welds and other types of equipment, as well as operator error and external forces. More details are found in Appendix A.
67. Katz, B. 2018. Keystone Pipeline Leak Was Twice as Big as Previously Thought. Smithsonian, April 9. https://www.smithsonianmag.com/smart-news/keystone-pipeline-leak-was-twice-big-previously-thought-180968722/#eWBDfHKsGoB3iPck.99
68. U.S. National Transportation Safety Board. 2018. Pipeline Accident Brief: TransCanada Corporation, Pipeline (Keystone Pipeline) Rupture, Amherst, South Dakota. July 5. https://www.ntsb.gov/investigations/AccidentReports/Reports/PAB1801.pdf
69. Donaghy & Stewart 2017
70. Combining PHMSA records for Enbridge Energy LP (Operator ID 11169, https://primis.phmsa.dot.gov/comm/reports/operator/OperatorReport_opid_11169.html) and North Dakota Pipeline Company LLC (Operator ID 15774, https://primis.phmsa.dot.gov/comm/reports/operator/OperatorReport_opid_15774.html)
71. Combining PHMSA records for Magellan Pipeline Company LP (Operator ID 22610, https://primis.phmsa.dot.gov/comm/reports/operator/OperatorReport_opid_22610.html) and Magellan Ammonia Pipeline LP (Operator ID 12105, https://primis.phmsa.dot.gov/comm/reports/operator/OperatorReport_opid_12105.html). Three early spills are listed as Williams Pipeline, prior to a 2003 name change.
72. PHMSA records for Flint Hills Resources LC, owned by Koch Pipelines Company (Operator ID 22855, https://primis.phmsa.dot.gov/comm/reports/operator/OperatorReport_opid_22855.html)
73. PHMSA records for Enterprise Products Operating LLC (Operator ID 31618, https://primis.phmsa.dot.gov/comm/reports/operator/OperatorReport_opid_31618.html)
74. PHMSA records for Kinder Morgan Cochin LLC (Operator ID 32258, https://primis.phmsa.dot.gov/comm/reports/operator/OperatorReport_opid_32258.html)
75. PHMSA records for Nustar Pipeline Operating Partnership LP (Operator ID 10012, https://primis.phmsa.dot.gov/comm/reports/operator/OperatorReport_opid_10012.html)
76. PHMSA records for Marathon Pipe Line LLC (Operator ID 32147, https://primis.phmsa.dot.gov/comm/reports/operator/OperatorReport_opid_32147.html)
77. Minnesota Department of Commerce. 2017. Final Environmental Impact Statement (MN FEIS). Chapter 5: Existing Conditions, Impacts, and Mitigation – Certificate of Need, Section 5.2.1, Table 5.2.1.2-2, p. 5-47 to 5-50. https://mn.gov/eera/web/project-file?legacyPath=/opt/documents/34079/Line%203%20Revised%20FEIS%20Ch%2005.pdf
78. MN FEIS. 2017. Chapter 5: Existing Conditions, Impacts, and Mitigation – Certificate of Need. Section 5.2.1. pp. 5-62.
79. MN FEIS. 2017. Chapter 5: Existing Conditions, Impacts, and Mitigation – Certificate of Need. Section 5.2.1. Table 5.2.1.1-4.
80. MN FEIS. 2017. Chapter 10: Accidental Crude Oil Releases, Tables 10.4-5 and 10.4-15. https://mn.gov/eera/web/project-file?legacyPath=/opt/documents/34079/Line%203%20Revised%20FEIS%20Ch%2010%20Accidental%20Releases.pdf
81. MN FEIS. 2017. Chapter 10: Accidental Crude Oil Releases, Tables 10.4-4 and 10.4-14.
82. MN FEIS. 2017. Chapter 10: Accidental Crude Oil Releases, Table 10.4-6
83. Pipeline Safety Trust. 2015. Emergency Response and Spill Response Planning. Pipeline Briefing Paper #12. September. http://pstrust.org/wp-content/uploads/2015/09/2015-PST-Briefing-Paper-12-Emergency-Response-and-Spill-Response-Planning.pdf
84. Zantow, E. 2018. Coast Guard Plan for Great Lakes Oil Spill Spurs Lawsuit. Courthouse News Service, August 22. https://www.courthousenews.com/coast-guard-plan-for-great-lakes-oil-spill-spurs-lawsuit/
85. MN FEIS. 2017. Line 3 Replacement Project: Assessment of Potential Pinhole Release. https://mn.gov/eera/web/project-file?legacyPath=/opt/documents/34079/Pinhole%20Release%20Assessment%20Text.pdf
86. Sanders-Reed, A. 2017. Social Cost of Carbon: Enbridge’s Line 3. https://www.edockets.state.mn.us/EFiling/edockets/searchDocuments.do?method=showPoup&documentId=%7B806A765E-0000-C118-86D6-0C8B470CCF0D%7D&documentTitle=20179-135432-01
87. Intergovernmental Panel on Climate Change (IPCC). 2018. Global Warming of 1.5 °C. http://www.ipcc.ch/report/sr15/
88. McSweeney, R. & R. Pearce. 2017. Analysis: Just four years left of the 1.5C carbon budget. Carbon Brief, April 5. https://www.carbonbrief.org/analysis-four-years-left-one-point-five-carbon-budget
89. Carbon Tracker Initiative. 2018. 2 Degrees of Separation: Company-level transition risk July 2018 update. https://www.carbontracker.org/reports/2-degrees-of-separation-update/
90. Carbon Tracker Initiative. 2018. Mind The Gap: the $1.6 trillion energy transition risk. https://www.carbontracker.org/reports/mind-the-gap/
91. International Energy Agency. 2017. World Energy Outlook 2017. https://www.iea.org/weo2017/
92. International Energy Agency. 2017. Energy Technology Perspectives 2017. https://www.iea.org/etp2017/
93. Greenpeace & Oil Change International. 2018. Off Track: How the IEA Guides Energy Decisions Towards Fossil Fuel Dependence and Climate Change. April. https://www.greenpeace.org.uk/wp-content/uploads/2018/04/OffTrackInvestorBriefing.pdf; Greenpeace & Oil Change International. 2018. Fact Check: IEA Climate Scenarios are not aligned with Paris Goals. October. https://www.greenpeace.org.uk/wp-content/uploads/2018/10/IEA-Scenarios-Fact-Check.pdf
94. Grubler et al. 2018. A low energy demand scenario for meeting the 1.5°C target and sustainable development goals without negative emission technologies. Nature Energy. https://www.nature.com/articles/s41560-018-0172-6.epdf?referrer_access_token=jZMkZolDA945IuYR_KM9DtRgN0jAjWel9jnR3ZoTv0PQDdUB8ux6MZx8X2nROb9RqsqDbDizmcbvgohOpDO2zV5u-28Do9dqjPQ3ceNElXNKNhTl9UAdYq-pHpNJX-27H0utNEZGMCOerqZJ15zWXHttVnEDA2fN0uCEMoqw940M7sHboeksrzBIWEcMv85EszakPED9mImlYF5lLLcC2ea607z2JoXR9dsjcVSzk6-wqLFsl_369aP3YBRhgrbIiSo3dve9RlrfnORLoSIb4x7sVmYCzZxJbw3V1m2U1u8%3D&tracking_referrer=www.carbonbrief.org
95. Muttitt 2016; see also Trout, K. 2018. The Sky’s Limit and the IPCC Report on 1.5 Degrees of Warming. Oil Change International. http://priceofoil.org/2018/10/17/the-skys-limit-ipcc-report-15-degrees-of-warming/
96. Canadian Association of Petroleum Producers. 2018. 2018 Crude Oil Forecast: Markets and Transportation. https://www.capp.ca/publications-and-statistics/crude-oil-forecast
97. Greenpeace & Oil Change International. 2017. Flawed Fundamentals: Shell’s and BP’s Stalled Tar Sands Ambitions. June. https://www.greenpeace.org.uk/wp-content/uploads/2017/06/FlawedFundamentalsTarSands.pdf; Scott & Muttitt 2017.
98. Shell. Sky Scenario. https://www.shell.com/energy-and-innovation/the-energy-future/scenarios/shell-scenario-sky.html; The Sky scenario is not truly “Paris compliant” as it relies on CCS technology and does not limit warming to 1.5°C.
99. International Institute for Applied Systems Analysis (IIASA). SSP Database (Shared Socioeconomic Pathways) – Version 1.1. https://tntcat.iiasa.ac.at/SspDb/dsd?Action=htmlpage&page=about
100. The “Other” category plotted here also includes power generation and energy losses, so that primary energy matches final consumption for each scenario. See Appendix A for more details on IEA’s Energy Balance calculations.
101. Minnesota Department of Commerce 2017.
102. Scott & Muttitt 2017; Erickson, P., M. Lazarus & K. Tempest. 2015. Carbon lock-in from fossil fuel supply infrastructure. Stockholm Environment Institute. https://www.sei.org/publications/carbon-lock-in-from-fossil-fuel-supply-infrastructure/; Erickson, P. 2018. Confronting carbon lock-in: Canada’s oil sands. Stockholm Environment Institute. https://www.sei.org/publications/confronting-carbon-lock-canadas-oil-sands/