ANNIVERSARY MATCH ALERT: Sustain the fight for our planet’s future.
Take Action
-
-
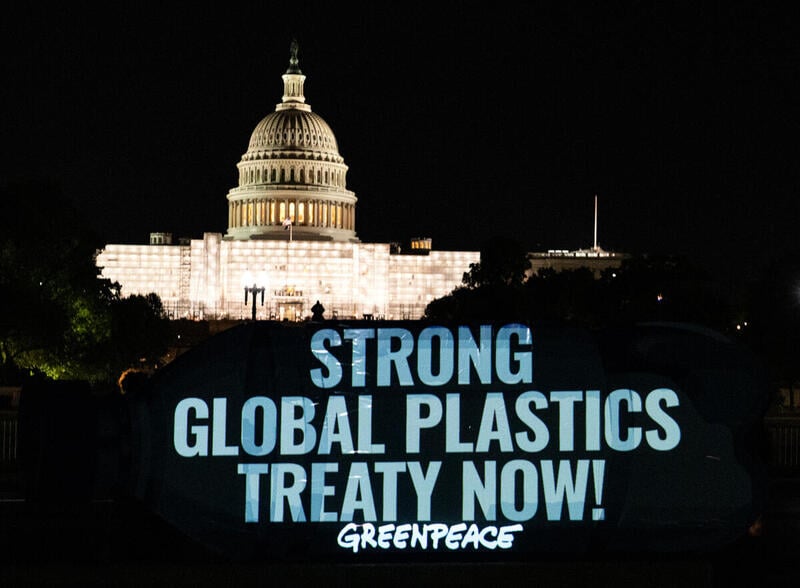
Help us end the age of plastics. Global Plastics Treaty Now!
-
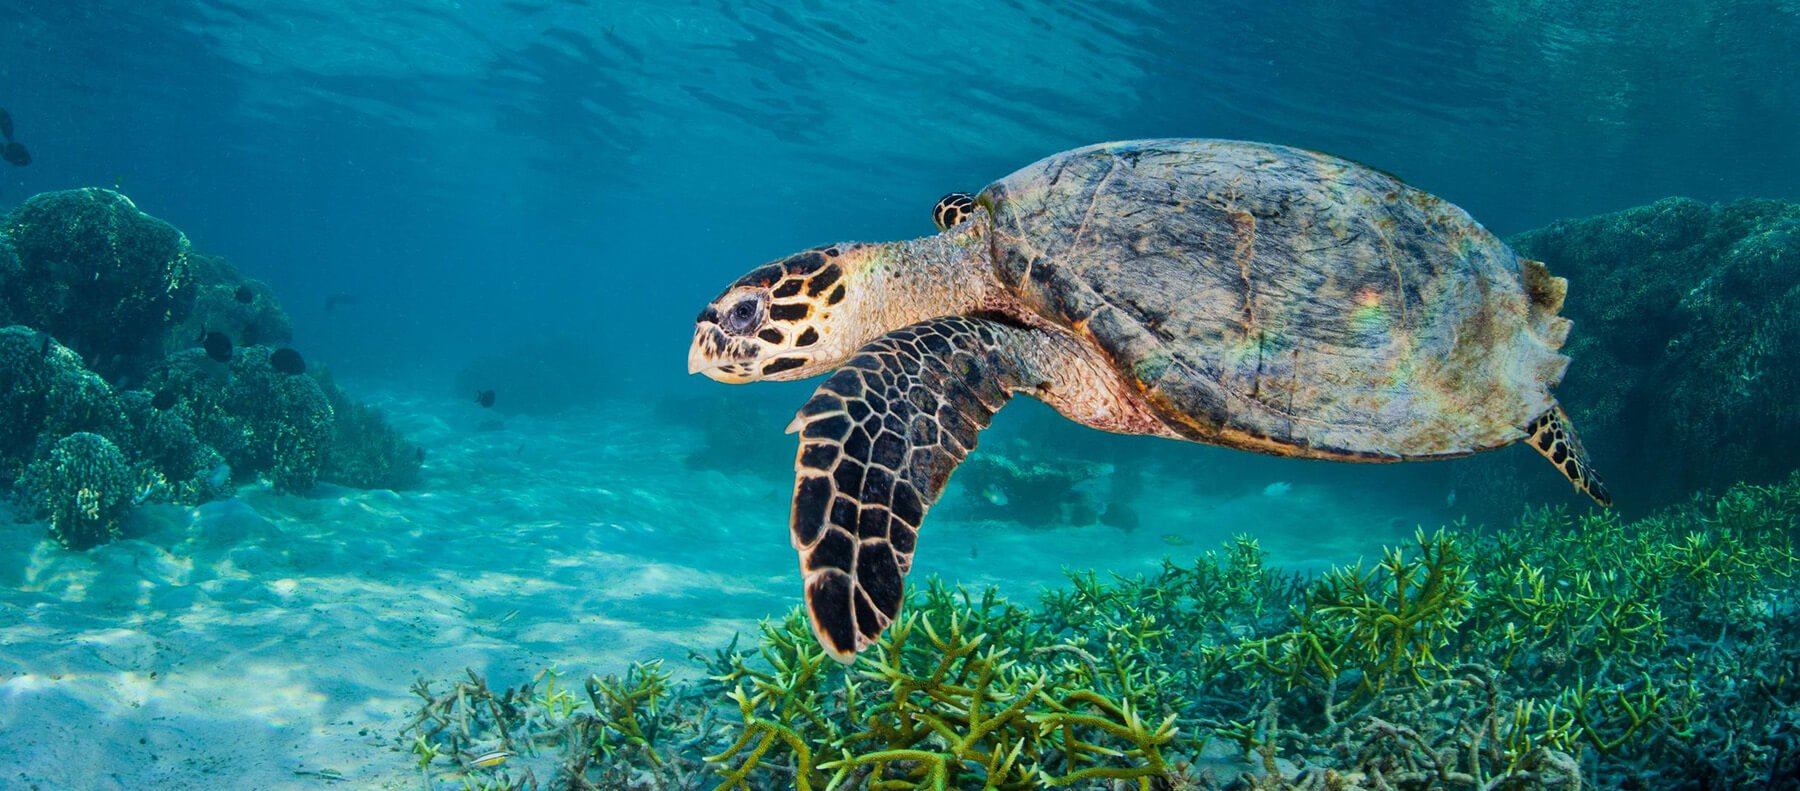
Tell President Biden to ban destructive Deep Sea Mining
-
Tell Congress: We Need Federal SLAPP Protection Legislation!
-
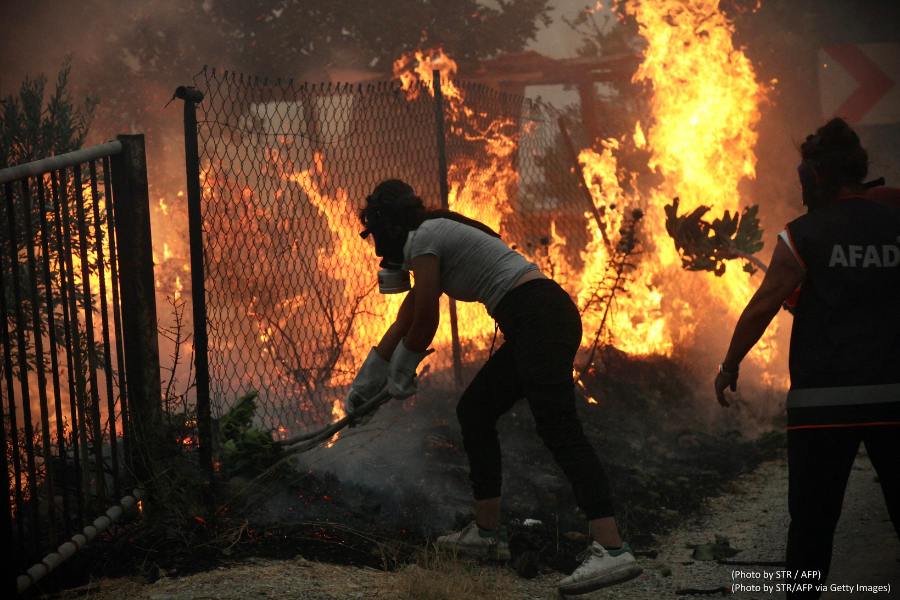
Urge CA Gov. Newsom to be the climate leader the world needs!
-
Urge California Governor Newsom to be the climate leader the world needs!


ALERT: Big Oil is suing Greenpeace USA
Greenpeace is facing a $300 million lawsuit from Big Oil that threatens to silence our vital work for people and the planet. Can you join us in our fight back?
Our Work
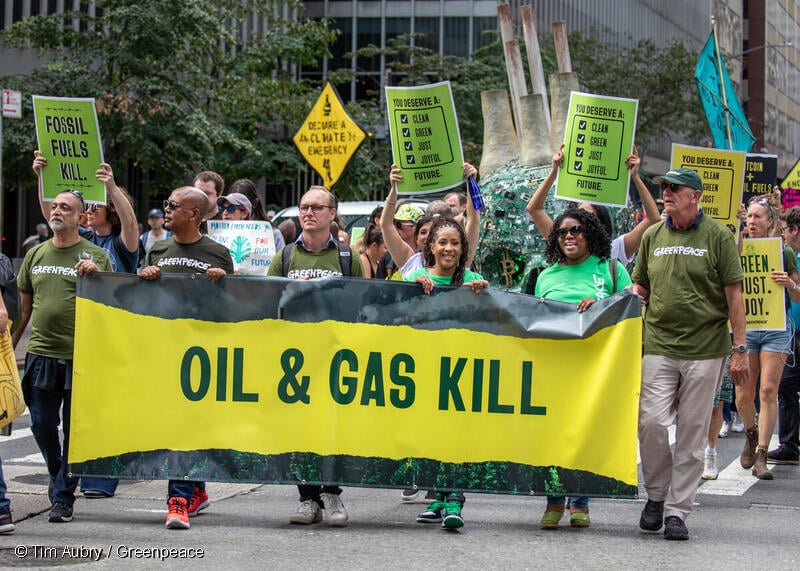
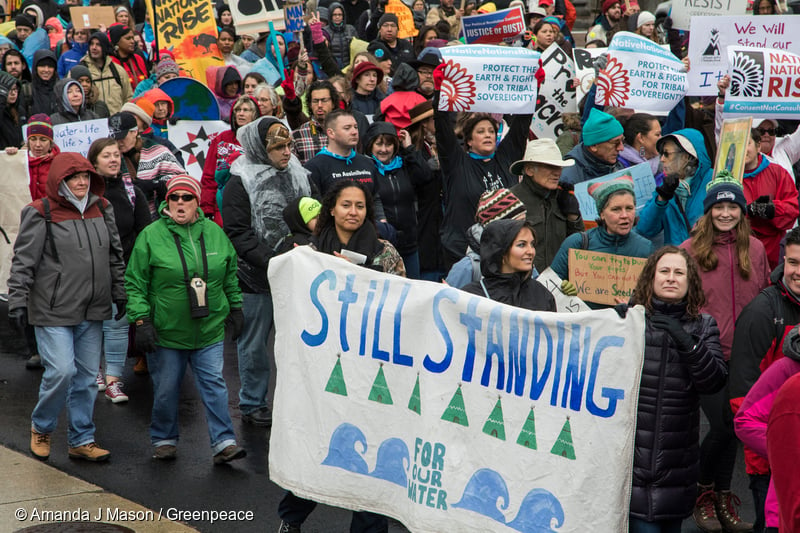
We've been campaigning for a green and peaceful future for over 50 years — and we're not stopping now. It's time to rise up like never before and fight for our climate and communities.
View our work