
Air Pollution Reported by Oil Refineries, Chemical Plants, and Industrial Facilities
Reports filed by companies to the Texas Commission on Environmental Quality (TCEQ) show that over 5.7 million pounds of air pollution were released by chemical plants, oil refineries and industrial facilities in the month after Harvey made landfall. 90% of this air pollution was released by 13 companies.
Click for full-page Hurricane Harvey Air Pollution Database. Scroll down for Methodology & References.
Total Air Pollution Reported: 5,700,328 lbs
Total of Most Hazardous Chemicals: 1,529,483 lbs
12 Companies Responsible for 90% Percent of Total Air Pollution:
- Magellan Midstream Partners, (2.529 million lbs, 44.4% of total)
- Valero Energy (579,351 lbs, 10%)
- Saudi Aramco (439,244 lbs, 7.7%)
- Dow Chemical (352,640 lbs, 6.1%)
- INEOS (244,111 lbs, 4.3%)
- Kinder Morgan (166,057 lbs, 2.9%)
- Formosa Plastics (160,692 lbs, 2.8%)
- Total (155,726 lbs, 2.7%)
- ExxonMobil (130,928 lbs, 2.3%)
- Enbridge (115,484 lbs, 2%)
- Royal Dutch Shell (114,996, 2%)
- LyondellBasell (114,749, 2%)
Total = 5,103,197; 90%
10 Companies Responsible for 90% Percent of Most Hazardous Chemicals:
- Magellan Midstream Partners, (534,310 lbs, 34.9%)
- Valero Energy (274,051 lbs, 17.9%)
- Saudi Aramco (179,118 lbs, 11.7%)
- Total (147,823 lbs, 9.7%)
- Enbridge (74,970 lbs, 4.9%)
- Dow Chemical (53,844 lbs, 3.5%)
- ExxonMobil (45,949 lbs, 3%)
- Cabot Oil & Gas (33,611 lbs, 2.2%)
- Royal Dutch Shell (32,777 lbs, 2.1%)
- Marathon Petroleum (24,768 lbs, 1.6%)
Total = 1,401,221 lbs, 91.6%
Economic Injustice:
42 out of 45 facilities are located in communities with above-average rates of poverty (excludes 11 facilities without available data)
Environmental Racism:
43 out of 45 facilities with available data are located in communities that are disproportionately inhabited by people of color (excludes 11 facilities without available data).
Cities facing the most air pollution:
- Galena Park (2.529 million lbs, 44.7% of total)
- Port Arthur (931,264 lbs, 16.34%)
- Freeport (351,519 lbs, 6.17%)
- Corpus Christi (301,734 lbs, 5.29%)
- Alvin (242,323 lbs, 4.25%)
- Houston (239,003 lbs, 4.19%)
Cities facing the most toxic chemicals:
- Galena Park (534,310 lbs, 34.9%)
- Port Arthur (508,793 lbs, 33.3%)
- Corpus Christi (112,377 lbs, 7.4%)
- Streetman (74,970 lbs, 4.9%)
- Freeport (53,842 lbs, 3.5%)
Total of Unspecified Volatile Organic Compounds (VOCs): 232,212 lbs
(See full-page Hurricane Harvey Air Pollution Database)
Mapping Tools for Harvey Pollution:
- Sierra Club & T.e.j.a.s.: Map of Hurricane Harvey: Toxic Sites
- Environmental Integrity Project: Map of Pollution Spills onto Land and Water During Hurricane Harvey
- Union of Concerned Scientists: Flooded by Hurricane Harvey: New Map Shows Energy, Industrial, and Superfund Sites
- Houston Advanced Research Center: Summarizing Hurricane Harvey’s Environmental Impacts
REFERENCES:
Community Groups, Scientists, and Environmental Advocates:
- Texas Environmental Justice Advocacy Services (T.e.j.a.s.): Toxic Tours
- Air Alliance Houston: Hurricane Links and Resources; and Air Pollution in the News (Harvey)
- Air Alliance Houston and Environmental Defense Fund: Damage to Valero Refinery Releases Benzene into Manchester Community
- Environment Texas and TexPIRG: Worried about pollution after Harvey?
- Sierra Club: At Least 10 Houston Area Chemical Facilities and Oil and Gas Refineries Have Already Reported Problems with Dozens More Threatened
- Center for Biological Diversity: Analysis: Nearly 1 Million Pounds of Seven Deadly Air Pollutants Released by Texas Refineries During Harvey Floods
- Union of Concerned Scientists & T.e.j.a.s.: Double Jeopardy in Houston: Acute and Chronic Chemical Exposures Pose Disproportionate Risks for Marginalized Communities (2016)
- Union of Concerned Scientists: As Arkema Plant Burns, Six Things We Know About Petrochemical Risks in the Wake of Harvey
- Earthjustice: see posts on Harvey written by Diane Carman, Mollie Fager, and Keith Rushing.
- Environmental Defense Fund and Environment Texas: Toxic Air Pollution is One of Harvey’s “Unseen Dangers”
- Greenpeace USA: Photos of Hurricane Harvey Impacts on Petrochemical Facilities
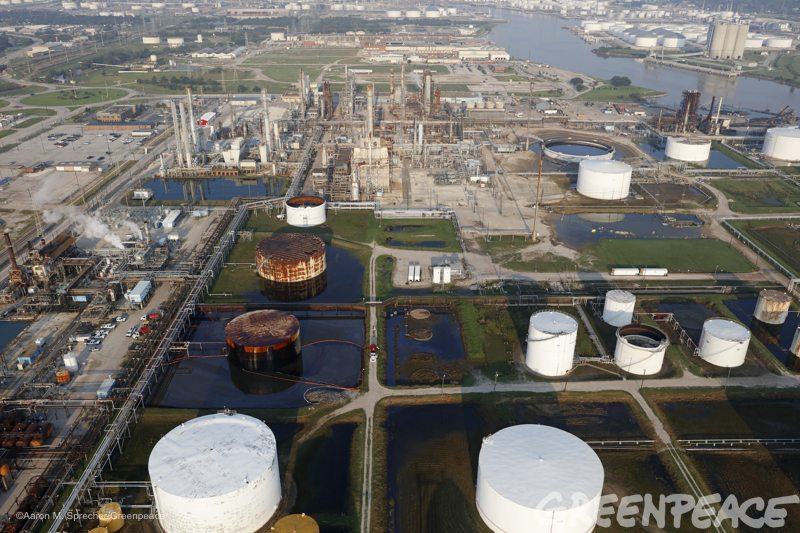
Activities at a refining plant in Port Arthur, Texas more than a week after Hurricane Harvey slammed the area. The human impacts of Hurricane Harvey have been staggering, and the greatest concern is for the people struggling in its aftermath. This disaster makes clear once again that coastal Texas and the wider Gulf region are on the frontlines of sea level rise and extreme weather heightened by climate change, as well as the toxic impacts from fossil fuel infrastructure.
Media Reports:
- Emily Atkin, “Unbearable” petrochemical smells are reportedly drifting into Houston, The New Republic, Aug. 28, 2017
- Dianna Wray, Is Harvey Also a Threat to the Air We Breathe?, Houston Press, Aug. 28, 2017
- Darryl Fears and Brady Dennis, Harvey’s flooding spurs concern about Houston’s toxic waste sites, Washington Post / Texas Tribune, Aug. 29, 2017
- Tracy Dang, Harvey prompts force majeures, more US plant shutdowns, ICIS News, Aug. 29, 2017
- Steven Mufson, ExxonMobil refineries are damaged in Hurricane Harvey, releasing hazardous pollutants, Washington Post / Texas Tribune, Aug. 29, 2017
- Benjamin Lefebvre, Harvey triggers spike in hazardous chemical releases, Politico, Aug. 29, 2017
- Mike Lee, Corbin Hiar, and Hannah Northey, Dozens of refinery leaks reported; more toxic spills likely, E&E Publishing, Aug. 30, 2017
- Tom DiChristopher, Harvey shuts down largest US oil refinery, bears down on Louisiana plants, CNBC, Aug. 30, 2017
- Floodwaters topple 2 oil storage tanks in south Texas, spilling almost 30,000 gallons of crude, Associated Press, Aug. 30, 2017
- Zoë Schlanger, Oil refineries in Hurricane Harvey’s path are polluting Latino and low-income neighborhoods, Quartz, Aug. 30, 2017
- Alessandra Potenza, Harvey’s flooding is triggering chemical spills, which could cause other environmental disasters, The Verge, Aug. 30, 2017
- David Sirota, Alex Kotch, Jay Cassano, and Josh Keefe, Texas Republicans Helped Chemical Plant That Exploded Lobby Against Safety Rules, International Business Times, Aug. 31, 2017
- Ben German, Harvey’s energy toll: refineries, pipelines and more, Axios, Aug. 31, 2017
- Mike Lee, Swamped chemical plant explodes, burns in storm’s wake, E&E Publishing, Aug. 31, 2017
- Matt Dempsey and Jordan Blum, Chemical facilities face danger during Harvey shutdowns, Chron.com, Aug. 31, 2017
- Brian New, More Fires At Flood-Hit Crosby Chemical Plant Expected, CBS 11 DFW, Aug. 31, 2017
- Todd C. Frankel, Abagail Hauslohner, David A. Farenthold, New dangers lurk in Harvey’s wake, Washington Post, Aug. 31, 2017
- Hiroko Tabuchi and Sheila Kaplan, A Sea of Health and Environmental Hazards in Houston’s Floodwaters, New York Times, Aug. 31, 2017
- Zahra Hirji and Jeremy Singer-Vine, Damage From Harvey Has Already Caused Millions Of Pounds Of Toxic Pollutants To Be Released Into The Air, Buzzfeed News, Aug. 31, 2017
- Jen Kirby, The Environmental Fallout of Hurricane Harvey, New York Magazine, Sept. 1, 2017
- Amelia Urry, Harvey stirs up a toxic, industrial soup, Grist, Sept. 1, 2017
- Lydia O’Neal, Court Rejects Environmental Groups’ Attempt To Block EPA’s Delay Of Chemicals Rule, International Business Times, Sept. 1, 2017
- Jessica Corbett, Analysis: Harvey Triggered Release of Nearly a Million Pounds of Toxic Air Pollutants, Common Dreams, Sept. 1, 2017
- Lorraine Chow, Arkema Plant Explosion Sparks Criticism of Trump EPA Relaxing Chemical Safety Rules, EcoWatch, Sept. 1, 2017
- Oliver Milman, ‘Your eyes start itching’: pollution soars in Houston after chemical industry leaks, The Guardian, Sept. 2, 2017
- Steven Mufson, Harvey causes chemical companies to release 1 million pounds of extra air pollutants, Washington Post / Texas Tribune, Sept. 4, 2017
- Ariel Wittenberg, Agencies warn Texas residents about spills, sewer systems, E&E Publishing, Sept. 5, 2017
- Amy Goodman, Renée Feltz and Hany Massoud with Bryan Parras, Petro Metro: A Toxic Tour of Houston from Refineries to Superfund Sites in Wake of Harvey, Democracy Now!, Sept. 5, 2017
- Hiroko Tabuchi, High Levels of Carcinogen Found in Houston Area After Harvey, New York Times, Sept. 6, 2017
- Troy Griggs, Andrew H. Lehren, Nadja Popovich, and Anjali Singhvi, More Than 40 Sites Released Hazardous Pollutants Because of Hurricane Harvey, New York Times, Sept. 6, 2017
- Jay Root, In Harvey’s wake, critics see big money behind lax petrochemical reporting, Texas Tribune, Sept. 7, 2017
- Keri Blakinger and Matt Dempsey, First responders sue Arkema for $1 million following explosions at Crosby plant, Chron.com, Sept. 7, 2017
- Julie Dermansky, From Homes to Refineries, Finding Pollution and Loss in Harvey’s Path, DeSmog, Sept. 8, 2017
- Frank Bajak and Michelle Minkoff, Residents cough, rub eyes in Harvey pollution spike, Associated Press, Sept. 8, 2017
- Jordan Blum, Magellan gasoline leak is biggest known spill of Harvey aftermath, Houston Chronicle, Sept. 11, 2017
- Vann R. Newkirk II, The Looming Superfund Nightmare, The Atlantic, Sept. 12, 2017
- Collin Eaton and Jordan Blum, Galena Park gasoline spill dwarfed other Harvey leaks, but stayed out of public eye for days, Houston Chronicle, Sept. 13, 2017
- Mose Buchele, 3 Ways Texas Could Safeguard Against Toxic Emissions During The Next Major Storm, KUT FM, Houston Public Media, Sept. 13, 2017
- Brentin Mock, Zoned for Displacement, City Lab, Sept. 13, 2017
- Kiah Collier, Lisa Song, and Al Shaw, EPA won’t release benzene levels collected post-Harvey; private tests show elevated levels, ProPublica & Texas Tribune, Sept. 14, 2017
- Kristen Hays, CP Chem post-Harvey inspections continue, no timeline for restart, Platts, Sept. 14, 2017
- Rebecca Hersher and David Schaper, Air Pollution From Industry Plagues Houston In Harvey’s Wake, National Public Radio (NPR), Sept. 14, 2017
- Rye Druzin, CEO Joe Gorder called last three weeks “pretty brutal” for Valero, San Antonio Express News, Sept. 14, 2017
- Spencer Starr, Eagle Ford Shale’s big operators getting output back to pre-Harvey levels, Platts, Sept. 15, 2017
- Emily Flitter and Richard Valdmanis, Oil and chemical spills from Hurricane Harvey big, but dwarfed by Katrina, Reuters, Sept. 15, 2017
- Alexandra Berzon, Valero Houston Plant Underestimated Harvey Benzene Leak, Wall Street Journal, Sept. 15, 2017
- Tsvetana Paraskova, Hurricane Harvey Oil, Chemical Spills Top 22,000 Barrels, Oil Price, Sept. 15, 2017
- Emily Flitter, Valero underestimated Houston refinery leak during Harvey, Reuters, Sept. 15, 2017
- Mark Hand, High levels of chemicals found in air around Houston refinery after EPA told residents not to worry, ThinkProgress, Sept. 15, 2017
- Olivia Pulsinelli, Former Shell Oil president named head of Houston’s Harvey recovery, Houston Business Journal, Sept. 15, 2017
- Meagan Parrish, Oil And Chemical Spills After Hurricane Harvey Vs. Katrina — By The Numbers, Chem Info, Sept. 15, 2017
- Ralph K.M. Haurwitz, Hurricane Harvey’s pollution toll on air, water slowly comes into focus, Austin American-Statesman, Sept. 15, 2017
- Doyin Oyeniyi, The Largest Harvey-Related Gasoline Spill Went Unknown for Weeks, Texas Monthly, Sept. 16, 2017
- Jordan Blum, Private air quality monitoring detects high levels of pollution following Harveys, Houston Chronicle, Sept. 16, 2017
- Jessica Summers and Barbara J. Powell, Far From the Texas Coast, Hurricane Harvey Hits Oil Refiners, Bloomberg, Sept. 18, 2017
- Julie Dermansky, Why Is a Dump for Hurricane Harvey Debris Next to an African American Community?, DeSmog, Oct. 9, 2017
- Tom DiChristopher, Exxon Mobil fires up huge new Texas plant just two months after Harvey hit the Gulf Coast, CNBC, Oct. 17, 2017
- Tsvetana Paraskova, Exxon Starts Production At New Refinery In Texas, Oil Price, Oct. 18, 2017
- Tarika Powell, Hurricane Harvey Highlights Fossil Fuel and Petrochemical Loopholes, Sightline Institute, Oct. 18, 2017
- Laura Blewitt, In ‘Energy City’ USA, Hurricane Harvey’s Fury Is Still Lingering, Bloomberg, Oct. 19, 2017.
- Alan Shields, INEOS hit by Hurricane Harvey hangover, Energy Voice, Oct. 19, 2017
- Abby Martin and Mike Prysner, Empire Files: The Sacrifice Zones of Hurricane Harvey, The Real News, Oct. 23, 2017
- Rebecca Hersher, Digging In The Mud To See What Toxic Substances Were Spread By Hurricane Harvey, National Public Radio (NPR), Oct. 23, 2017
- Flesh-eating bacteria from Harvey debris kills Texas man, CBS News / Associate Press, Oct. 25, 2017
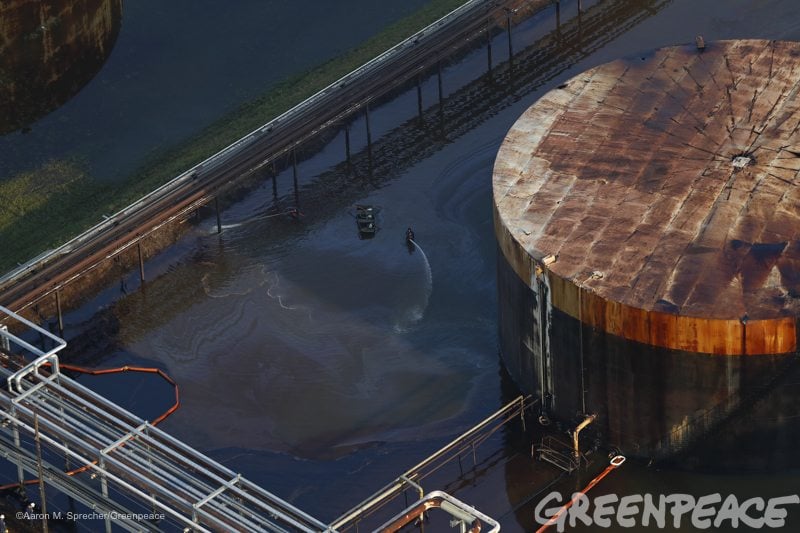
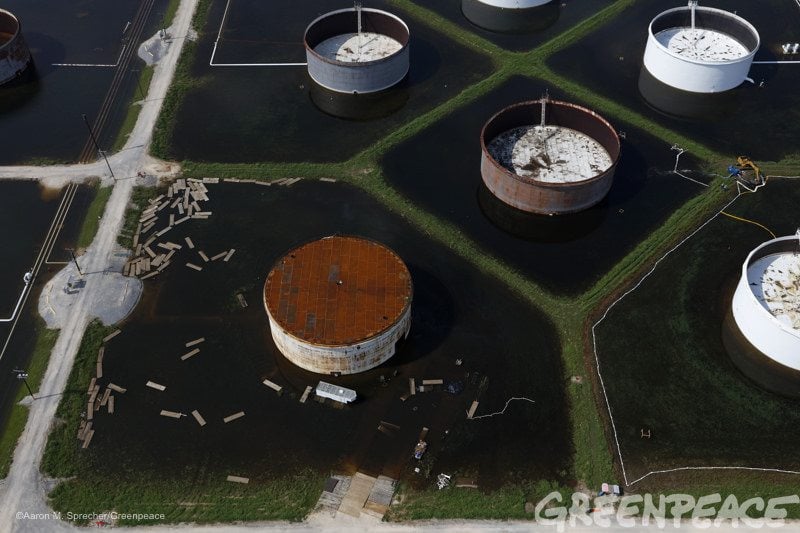
Workers in protective suits stand in the middle of oil covering Hurricane Harvey flood waters at a refinery in La Porte, Texas, more than a week after the hurricane hit the area. The human impacts of Hurricane Harvey have been staggering, and the greatest concern is for the people struggling in its aftermath. This disaster makes clear once again that coastal Texas and the wider Gulf region are on the frontlines of sea level rise and extreme weather heightened by climate change, as well as the toxic impacts from fossil fuel infrastructure.
METHODOLOGY:
Data collection began on September 5, 2017, with help from Athena Matyear. There were only 39 final reports filed at that time. This limits our data, as final reports replace the initial reports on the TCEQ website after being filed (out of 143 final reports). Thus, 39 initial reports filed by 26 distinct facilities are missing from our collection.
For comparison sake, we included the ability to swap between data from initial and final estimates of pollution reported to TCEQ. Users can see which companies initially underestimated their air pollution, and which companies over-estimated the extent of pollution.
We included every incident reported to TCEQ Regions 10 (Beaumont), 12 (Houston) and 14 (Corpus Christi) from August 23, 2017, when many refineries began to shut down, to September 25, 2017, a month after Harvey made landfall. We also included data from other TCEQ regions when reports clearly indicated that the pollution was a consequence of hurricane Harvey.
As of October 24, 2017, not all final reports have been published. 20 final reports remain un-filed. Many of these reports are “opacity events,” an industry term for smoke pollution at facilities, which are not measured in pounds and will not affect current totals.
We merged a few groups of chemicals for the sake of simplifying some of the data that is displayed. We consolidated various types of butanes, butenes, pentanes, pentenes, and xylenes, which were (infrequently) reported by companies with specific isomers or variations. We merged “xylene, mixed isomers” and “xylene-n” into “xylenes,” as an example. We also combined nitrogen oxide (NO) and nitrogen dioxide (NO2) to display as “Nitrogen Oxides (NOx),” as both chemicals have similar effects in terms of acid rain, smog formation, and human health. All other chemicals are listed exactly as companies reported them. If in doubt, follow our sources to the TCEQ website and look at the exact entry by the company.
“Most Hazardous Chemicals”
With credit to a September 1, 2017 report by Shaye Wolf at the Center for Biological Diversity, our “most hazardous chemicals” list is very similar:
“Parent Company”
In many cases, the TCEQ reports filed by petrochemical and industrial facilities are credited to the company that owns or operates the facility, but not the ultimate parent company. To the best of our ability, we have identified the ultimate parent company of each of the subsidiaries that filed reports.
“Source Report No.”
Each TCEQ has a six-digit number attributed to it. Adding this feature as a row or column of the database allows you to click on individual cells and open up the primary source data, and a link to the TCEQ page.
“Equipment Source of Contaminant”
Many of the facilities that were hit by Harvey are very large, and emitted air pollution from several distinct areas within the facility. The TCEQ reports specify which equpiment that chemicals were leaked, spilled, or flared from.
ENVIRONMENTAL JUSTICE DATA:
Population demographics around specific industrial facilities was published in 2016 by the Political Economy Research Institute (PERI) at the University of Massachusetts, Amherst. See PERI’s methodology for “environmental justice ratios” which notes that “in 2014 in the U.S., the share of people living in poverty was 14.5% and the share of the population that identified as Hispanic or nonwhite was 36.3 percent.”
This data is displayed as “Population Living in Poverty (%)” and “Population People of Color (%).” It is only applicable to specific facilities–for example, the data will not display as averages if you attempt to apply “Population People of Color” to the county of Brazoria, or to all facilities owned by ExxonMobil.
Some data was not available, but for seven facilities without available data, we were able to locate other facilities in the PERI database that are physically close (within a mile) of the facility without data. Here are the exact substitutions we used:
-
-
- For the Citgo Corpus Christi refinery, PERI data from Koch Industries’ Flint Hills West refinery
- For the Kinder Morgan Pasadena Terminal, PERI data from the Petrobras Pasadena Refinery
- For the Air Liquide facility in Pasadena, PERI data for the Baker Hughes Pasadena facility
- For the Blue Cube Operations facility in Freeport, PERI data from the Dow Chemical plant in Freeport
- For the INEOS plant in Pasadena, PERI data from BASF Pasadena
- For the MPLX Javalina plant in Corpus Christi, PERI data from the closest Air Products facility in Corpus Christi.
-
And, for the Magellan Midstream facility in Galena Park, data was provided by the Union of Concerned Scientists and T.e.j.a.s. 2016 report, “Double Jeopardy in Houston.”
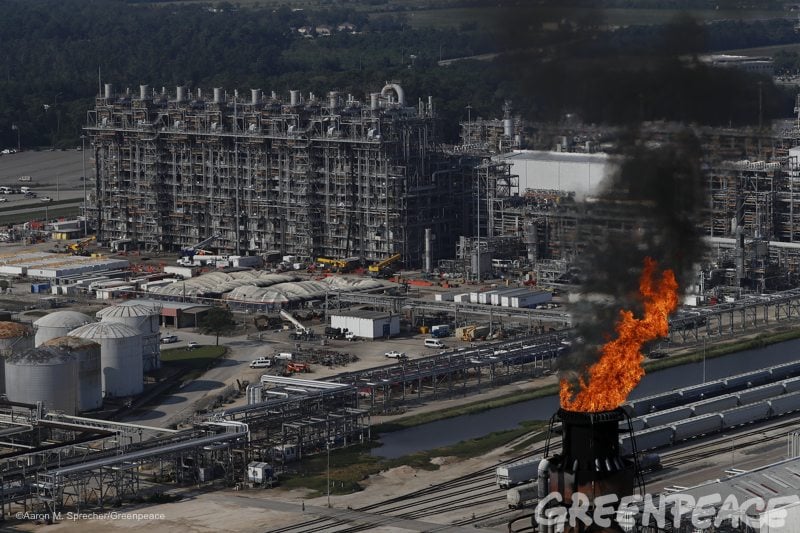
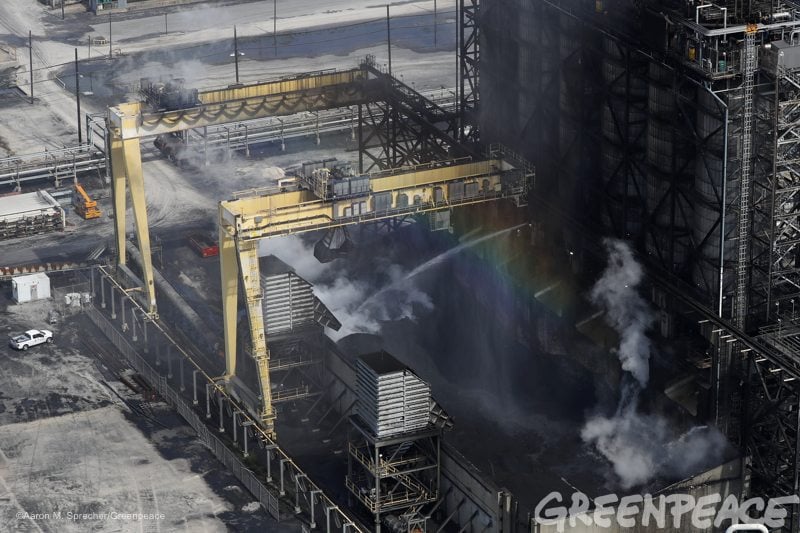
A flare burns at an oil refinery in Baytown, Texas more than a week after Hurricane Harvey ravaged the area. The human impacts of Hurricane Harvey have been staggering, and the greatest concern is for the people struggling in its aftermath. This disaster makes clear once again that coastal Texas and the wider Gulf region are on the frontlines of sea level rise and extreme weather heightened by climate change, as well as the toxic impacts from fossil fuel infrastructure.
SOURCE DATA:
Our source spreadsheet is available for download, below.
Primary sources directly from TCEQ is easy to access, via a pop-up menu, by clicking the any of the cells in the database while the “Source Report No.” realm is included.
Greenpeace compiled air pollution reports submitted to the Texas Commission on Environmental Quality (TCEQ) that occurred during the Hurricane Harvey disaster. TCEQ reports submitted by petrochemical refineries, chemical plants, oil & gas compressor stations, terminals, and other industrial sites provide estimates of the type and amounts of chemicals released, in pounds. Data includes pollution from the shutdown and start-up process for many refineries and chemical plants, as well as releases due to physical damage from Harvey.
This data is voluntarily reported by the facilities and companies. There were no official air monitoring efforts by state or federal officials during and after hurricane Harvey, and thus, no way to verify data submitted to TCEQ.
Greenpeace’s database does not include filings to the Texas Railroad Commission, the U.S. Environmental Protection Agency (EPA), the U.S. Coast Guard, or any other government agencies.
Data does not include estimates of chemicals released from Superfund sites, Brownfields, sewage and water treatment facilities, or other potential point-sources of air and water pollution reported after the storm.