Ten Republicans and four Democrats represent the regions of the country where the vast majority of U.S. crude oil is produced — showing why we need a just transition away from dirty energy now.

Ten Republicans and four Democrats represent the parts of the country where the vast majority of U.S. crude oil is produced. As the 116th Congress gets down to work, we take a look at these districts and what their Representatives received in campaign contributions from the oil and gas industry.
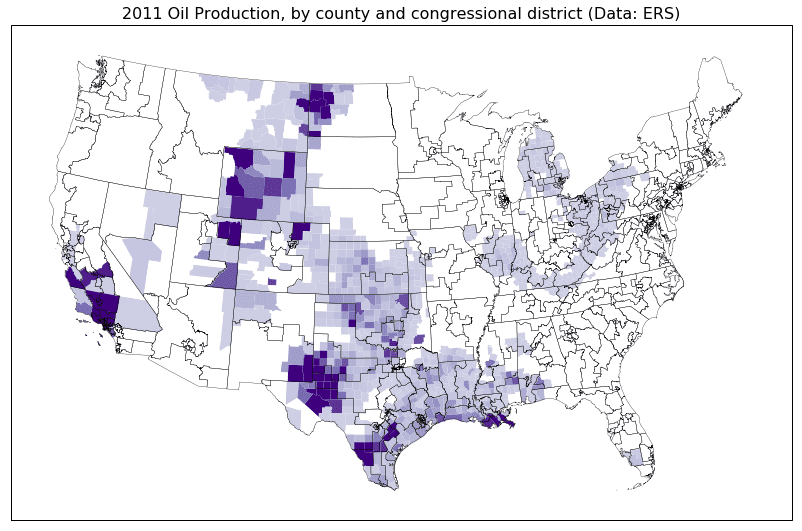
There isn’t a readily available current dataset of oil and gas production broken down by House Districts, so what follows is a rough estimate that can hopefully be improved. Data collected by the Economic Research Service of the USDA tabulates oil production by county for the years 2000 to 2011. The map below shows this county-level data for the lower 48 states in 2011, with the boundaries of the House Districts overlaid.

© Greenpeace USA/Tim Donaghy
The map clearly shows the major regions that are the source of the booming oil and gas production in the U.S. The dark purple splotch in west Texas and New Mexico is the Permian basin, which has shown rapid growth in the past decade thanks to the shale boom and is currently seeing a rapid build-out of pipeline capacity to get its product to domestic and international markets. Other key oil-producing basins are the Bakken (in North Dakota, source of the controversial Dakota Access Pipeline), the Eagle Ford (south Texas), and the Niobrara (Wyoming and Colorado). Unsurprisingly, the geographic pattern of oil and gas extraction matches the locations of communities where oil and gas jobs make up a large fraction of the available employment.
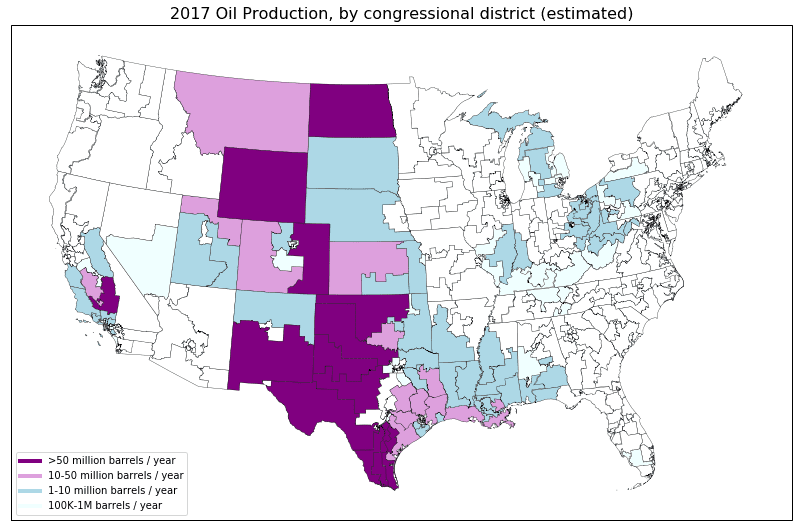
However, a lot has happened since 2011. In recent years, oil production has increased rapidly in places like the Permian, the Eagle Ford, and the Bakken, while declining in other places. To get a (very) crude estimate for which Congressional Districts are currently home to the most oil production we can make a few assumptions to create the map below (see the Endnote for more details on the calculation).
We find that only 14 Congressional Districts produced roughly 80% of onshore U.S. oil in 2017. These districts, marked in dark purple above, form a corridor through the center of the country, stretching from Texas to North Dakota. (Alaska’s at-large district is not shown on the map, but is one of the 14.) Together the politicians who represent these 14 districts accepted over $1.7 million in campaign contributions from the oil and gas industry in 2018.

© Greenpeace USA/Tim Donaghy
The single House district with the highest oil production is North Dakota’s At-Large District which encompasses the majority of the Bakken region and which produced 390 million barrels of oil in 2017.
- North Dakota is represented by Kelly Armstrong (R) who received $217,751 in oil and gas money in 2018, placing him 10th overall in oil and gas contributions among House candidates. Former Representative Kevin Cramer (R) successfully defeated Senator Heidi Heitkamp to flip one of North Dakota’s Senate seats in 2018. Cramer raked in $417,646, placing him 4th among all Senate candidates in oil and gas contributions (Heitkamp was 5th with $363,596).
The most productive oil region in the U.S. in recent years has been the Permian basin, represented by three districts in Texas and one in New Mexico. All told, the Permian produced a whopping 890 million barrels of oil in 2017, placing these four House districts at #2, 3, 4 and 6 in our approximate rankings.
- Texas 23rd: Located along the border with Mexico in southwest Texas, and represented by Will Hurd (R), who won a very narrow race over Democrat Gina Ortiz Jones. Hurd received $394,677 from the oil and gas industry — the 2nd highest total among all House candidates in 2018. In comparison, his opponent only received $11,413.
- Texas 11th: This district is located to the north of the 23rd district and is represented by Mike Conaway (R), who received $113,300 from the oil and gas industry in 2018.
- Texas 19th: This district is located to the north of the 11th district and is represented by Jodey Arrington (R), who received $62,100 from the oil and gas industry in 2018.
- New Mexico 2nd: Representing the southeastern corner of New Mexico, Democrat Xochitl Torres Small (D) narrowly won this previously Republican-held district. Torres Small received $7,805 from the oil and gas industry, compared to $108,500 for her Republican opponent, Yvette Herrell.
In the 2018 Texas Senate race, Ted Cruz and Beto O’Rourke raised over $1 million between them from the oil and gas industry.
Following the Permian, Alaska’s At-Large District produced 180 million barrels of oil in 2017, much of it from the North Slope oil fields.
- Alaska has been represented by Don Young (R) for many decades, who received $84,250 in oil and gas money in 2018.
The remaining eight House districts likely produced something in the range of 50-100 million barrels of oil in 2017, including parts of the Eagle Ford, Niobrara, Anadarko, and Central Valley oil regions.
The Eagle Ford stretches across eight districts in south Texas and generated around 430 million barrels of oil in 2017. Key House districts in this basin include:
- Texas 28th: Represented by Henry Cuellar (D), who was the top Democratic recipient of oil and gas money in 2018, with $165,900.
- Texas 15th: Represented by Vicente Gonzalez (D), who received $53,250
- Texas 34th: Represented by Filemon Vela (D), who received $38,500
The Eagle Ford also intersects Texas’s 27th, 10th, 17th, and 8th districts, as well as part of the 23rd district mentioned above.
The Niobrara basin — located in Wyoming and Colorado with some production in western Nebraska and Kansas — produced around 170 million barrels of oil in 2017. Key districts include:
- Wyoming’s At-Large District: Represented by Liz Cheney (R), who was recently elected Republican Party Conference Chair, and who received $82,900 in oil and gas money.
- Colorado 4th: Represented by Ken Buck (R), who received $45,700.
The Anadarko basin is found in the “panhandle” regions of western Oklahoma and north Texas and produced around 160 million barrels of oil in 2017. The region is covered by two districts:
- Texas 13th: Represented by Mac Thornberry (R), who received $32,125.
- Oklahoma 3rd: Represented by Frank Lucas (R), who received $62,500.
California’s oil fields, stretch across several districts in the Central Valley and Southern California, but in particular:
- California 23rd: Represented by House Minority Leader Kevin McCarthy (R), who was the #1 recipient of oil and gas largesse with $405,850 in contributions in 2018.
There are a lot of factors that determine how much money a candidate could receive from the oil and gas industry, but in general, Republicans receive over 85% of the contributions. Among House candidates receiving more than $100,000 in oil and gas money, 37 were Republicans while only two were Democrats. Unsurprisingly, competitive races often attract more donations than safe seats, and senior House leaders and powerful committee chairs can often command large checks from industries they are charged with regulating.
The contribution numbers combine individual donations from oil and gas industry employees (everyone from the CEO to drilling crews) together with contributions from PACs and other industry organizations. Separating these two sources of money is a topic for a future post, but it is clear that oil and gas campaign money does correlate broadly with oil production.
However, among the top money recipients from the oil and gas industry, we do find a number of top House Republican leaders and powerful committee chairs — irrespective of whether they have a heavy oil and gas presence in their district. Former House Speaker Paul Ryan was the 3rd highest recipient (R-Wisconsin, $365,878), along with McCarthy, House Minority Whip Steve Scalise (R-Louisiana, $324,695), former Ways and Means chair Kevin Brady (R-Texas, $353,735), and former Energy and Commerce chair Greg Walden (R-Oregon, $288,150). Both Ryan and Walden scored large donations despite having little to no oil and gas production in their states.
These maps point at the two twinned problems that have so far stymied action on climate change: the political power of the fossil fuel industry, and its economic clout. Real climate leadership will have to promote policies that address both of these issues — both rescuing our politics from the corrupting influence of corporate cash, and building a transition away from dirty energy that ensures that workers and communities in these oil districts are left better off than before.
Endnote: We start with county-level oil production data from the USDA (source: Economic Research Service (ERS). County-level Oil and Gas Production in the U.S.). This dataset only covers the years 2000-2011, which predates much of the shale revolution, and so the patterns of oil and gas production have likely shifted somewhat in recent years. We update this data to 2017 by scaling each county’s production either by state-level trends (source: EIA Crude Oil Production by State) or — in the case of Texas, New Mexico, Oklahoma, Arkansas, and Louisiana — by basin-level trends (source: EIA Drilling Productivity Report).
Production by District is estimated by assuming that production is evenly spread across the individual counties and which can be combined by measuring the area overlap between county and district boundaries. County boundaries are shown faintly in white, while district boundaries are black.
We caution that these numbers are only approximate, and further research into state-level production data is needed for a more accurate calculation. This post focuses on oil producing regions; for future posts, we’ll take a look at natural gas production, as well as other aspects of the industry, such as pipelines, refineries, and petrochemicals.
