Published: 01-28-2020
Download: PDF
A policy briefing from Greenpeace USA and Oil Change International shows that reinstating the U.S. crude oil export ban could reduce global emissions by the equivalent of closing 19 to 42 coal plants.
[vc_section el_id=”crude-oil-export-ban”][vc_row css=”.vc_custom_1523628767264{margin-top: -30px !important;margin-bottom: 30px !important;}”][vc_column][vc_row_inner][vc_column_inner][/vc_column_inner][/vc_row_inner][vc_column_text]A report authored by Greenpeace USA and Oil Change International
![]()
![]() [/vc_column_text][/vc_column][/vc_row][vc_row el_id=”executive-summary”][vc_column][vc_column_text el_id=”#summary”]
[/vc_column_text][/vc_column][/vc_row][vc_row el_id=”executive-summary”][vc_column][vc_column_text el_id=”#summary”]
Executive Summary
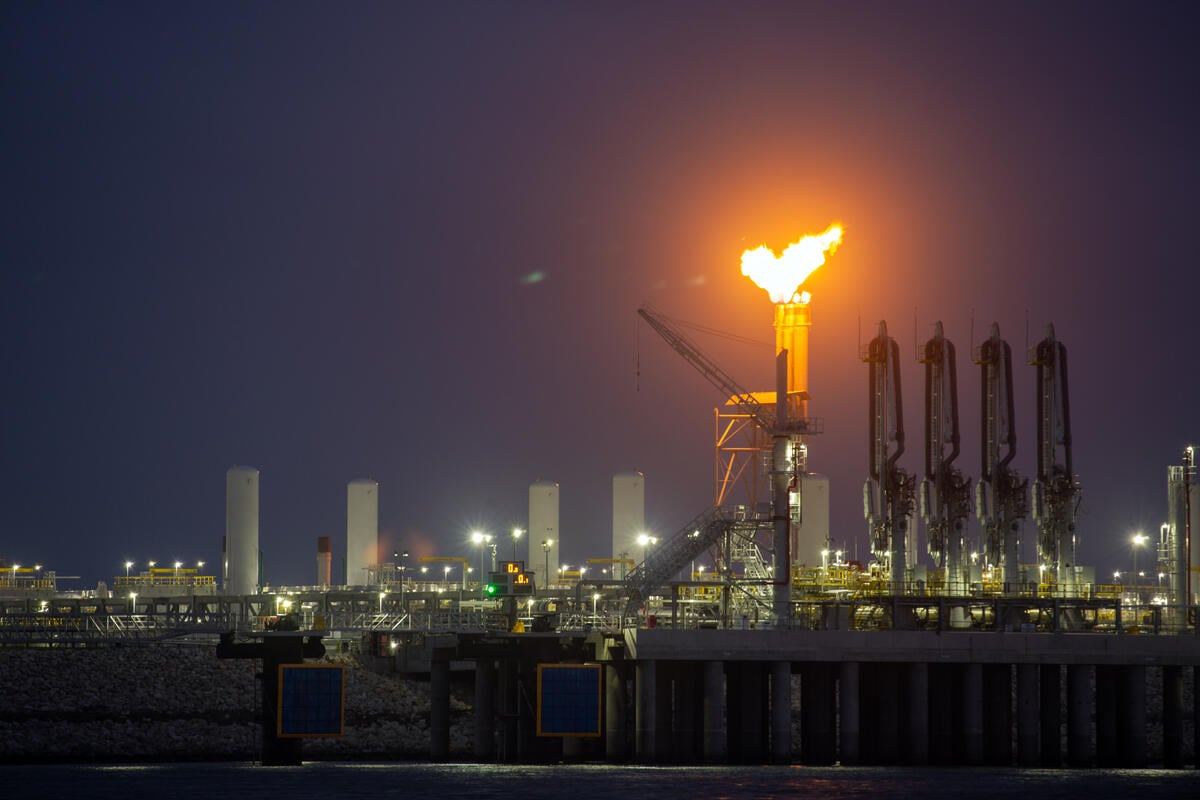
A growing body of research has shown that continued investment in fossil fuel extraction will put global climate goals out of reach.[1][2] The contradiction between a climate-safe emissions trajectory and increasing fossil fuel production is most stark in the United States, which the shale boom has made the world’s leading oil and gas producer.[3] One key factor in triggering this boom was the 2015 removal of the decades-old ban on crude oil exports. As Jim Teague, the chief executive of Enterprise Products, the U.S.’s largest crude exporter, told The Dallas Morning News in November 2019, “Without the crude oil export ban repeal, the United States would not be producing half of the oil it is today because it could not be exported.”[4]
The surge of oil and gas production in recent years has placed the planet at great risk, and policymakers must act swiftly to rein in expansion and bring sanity to U.S. energy policy.
The next president and Congress must reinstate the crude oil export ban as one part of a suite of ambitious Green New Deal policies to phase out fossil fuel production, ensure justice and equity for workers and communities, and transform the U.S. economy. Restoring the ban would not be a new step for the federal government — to the contrary, export restrictions were the norm for decades — but rather an admission that removing the ban in 2015 was an error that has deepened the climate crisis and made the needed transformation of the U.S. energy system significantly more difficult.
In this briefing, we find that reinstating the U.S. crude oil export ban could lead to reductions in global carbon emissions by as much as 73 to 165 million metric tons of CO2-equivalent each year. Reinstating the ban would also send a strong signal to energy investors that the fossil fuel era is drawing to a close, act as a failsafe against future export-directed investments and carbon leakage, and provide a useful policy lever over emissions beyond U.S. borders.
This range of carbon emissions reductions is the equivalent of closing between 19 and 42 coal plants, and delivers a carbon benefit comparable to implementing President Barack Obama’s proposed light-duty vehicle efficiency standards. This range of carbon reductions arises from considering a range of plausible scenarios, although the uncertainty in some key parameters is large and the carbon benefit could be larger or smaller. Crucially, ambitious policies to constrain and phase out fossil fuel production must be carried out in tandem with strong just transition policies to ensure that the lives and livelihoods of industry workers and communities are protected and improved throughout the transition.
The next president has the legal authority to reinstate crude oil export restrictions by declaring a national climate emergency, but ultimately, Congress must act to incorporate export restrictions as an essential part of U.S. energy policy for the twenty-first century. The speed and scale of the climate crisis demands bold action from policymakers, who must respond with all available policy tools.[/vc_column_text][/vc_column][/vc_row][vc_row el_id=”ban-introduction”][vc_column][vc_column_text]
America’s Crude Oil Export Ban
America’s crude oil export restrictions were initially legislated in response to the Arab Oil Embargo of October 1973. The oil embargo was itself a response to the U.S. arming of Israel following attacks by Syria and Egypt during the Yom Kippur War, and while it only lasted six months, its impact triggered a U.S. oil policy framework that would last over 40 years.
The Mineral Leasing Act of 1920 was amended in November 1973 to restrict crude oil exports, stipulating that export licenses can only be granted under certain conditions, including if the president provides evidence to Congress that exporting crude oil would not diminish the quantity or quality of U.S. oil supply.[5]
The Energy Policy and Conservation Act (EPCA) of 1975 cemented these restrictions within a broader energy policy clearly focused on energy conservation and security.[6] The EPCA gave the president authority to restrict crude oil exports as well as other energy commodities, and to allow exemptions “which he determines to be consistent with the national interest and the purposes of this Act.”[7] Other key oil-related provisions in the EPCA included the creation of the Strategic Petroleum Reserve and the vehicle fuel efficiency program known as CAFE (Corporate Average Fuel Efficiency).
As a result of the EPCA and subsequent amendments to existing legislation including the Outer Continental Shelf Lands Act and Naval Petroleum Reserves Production Act, by the late 1970s the U.S. allowed for crude oil exports only under a few limited circumstances:
- Exports of Californian heavy oil (20º API gravity or less), up to an average of 25,000 barrels per day (bpd);
- Exports to Canada if the oil is refined or consumed within Canada;
- Exports of oil sourced from the Cook Inlet in Alaska;
- Exports to Canada of oil sourced from Alaska’s North Slope and transported over the Trans-Alaska Pipeline, up to an average of 50,000 bpd;
- Exports of oil from the Strategic Petroleum Reserve if an equivalent amount of refined product is exchanged in return;
- Exports of foreign crude oil if documentation is provided showing it has not been commingled with domestic oil during its transit through the United States.
[/vc_column_text][/vc_column][/vc_row][vc_row el_id=”history”][vc_column][vc_column_text]
The History of Crude Oil Exports
As a result of these exemptions, some crude oil was exported during the late 1970s, 1980s, and 1990s, primarily from Alaska. Because Alaska was so distant from key U.S. refining markets other than the west coast, limited exports were allowed to prevent large discounts on Alaskan oil prices.
Data from the U.S. Energy Information Agency (EIA) does not detail exports by destination until 1993, but the limited data available suggest that the U.S. Virgin Islands were a major destination for Alaskan crude oil until around 1995, when restrictions were further lifted on North Slope crude oil.[8] Following this, Asia became a prime destination until around 2000, when declining Alaskan oil production reduced exports significantly. Some of the crude exported in this period may have been foreign crude that was imported to the United States and re-exported.[9]
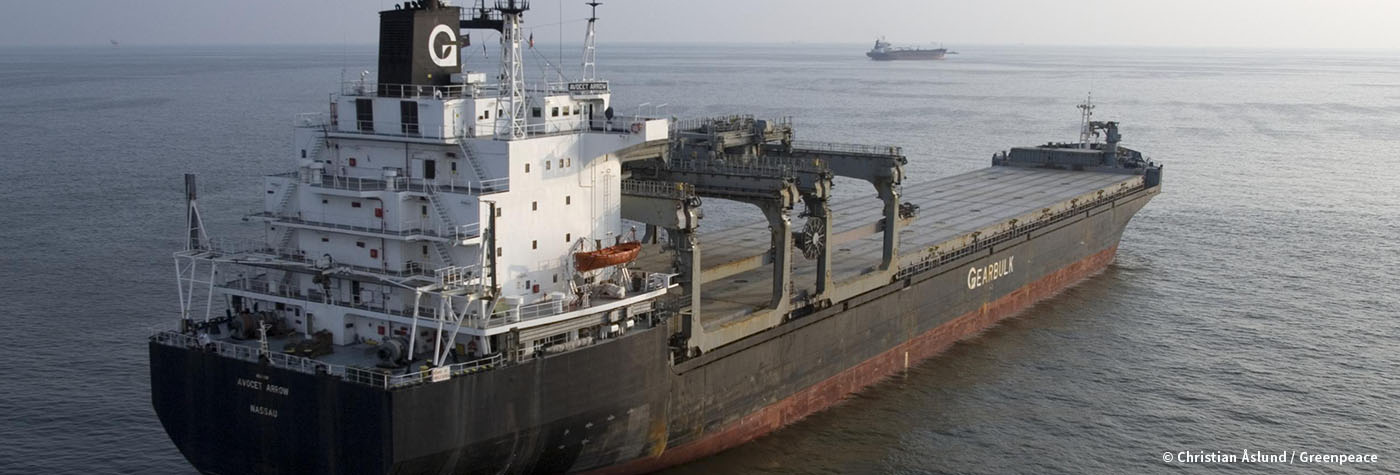
These limited exports averaged around 150,000 bpd from the late 1970s to late 1990s, before dropping dramatically in the 2000s (Figure 1). During this time period, U.S. oil production averaged over 7.8 million bpd; therefore, under 2 percent of U.S. crude was exported. By contrast, 2019 figures through October show an average of 2.9 million bpd exported, which is around 24 percent of 2019 oil production.[/vc_column_text][vc_single_image image=”76787″ img_size=”full” add_caption=”yes” css=”.vc_custom_1584470548199{margin-bottom: 30px !important;}”][vc_column_text]After 2010, and accelerating after 2012, the shale oil boom led to a resurgence of U.S. production, and of the still limited crude exports facilitated through exemptions to the crude export ban. In 2013, exports surpassed 100,000 bpd for the first time since 1999. 2014 saw a dramatic jump to 350,000 bpd, the highest level on record. 2015 was the last year of export restrictions, as the ban was lifted in mid-December 2015. Exports reached 465,000 bpd on average, representing 4.75 percent of U.S. production that year.
Over 90 percent of this crude was exported to Canada, which was permissible under the existing regulations. Limited exports to other countries were the result of occasional shipments of condensate — an ultra-light liquid sometimes categorized with gas and sometimes with oil — licensed by the U.S. Bureau of Industry and Security.[10]
Exports to Canada primarily traveled by rail from North Dakota, with some Eagle Ford crude traveling by ship from Corpus Christi, Texas, to refineries on the east coast of Canada.[11] Since the crude export ban was lifted in 2015, exports to Canada have remained at roughly the same levels, indicating that Canadian demand for U.S. oil Canada was largely being met prior to the ban being lifted.[12][/vc_column_text][/vc_column][/vc_row][vc_row el_id=”lifting-the-ban”][vc_column][vc_column_text]
Lifting the Export Ban: The Oil Lobbyists Descend on Washington
In 2013, oil producers began a major lobbying effort to overturn the crude oil export regulations. This push was initially led by Exxon[13] and the American Petroleum Institute.[14] Former Congressman Joe Barton, a Republican from Texas who became the key driver of legislation to repeal the ban, recalled his being approached by ConocoPhillips lobbyists in early 2014. “I opposed the idea, because I thought we should keep our oil in the U.S. But then I heard from Scott Sheffield, the chief executive of Pioneer Natural Resources. Pioneer was a major producer in the Permian, and if the crude oil export ban was not lifted, he said, Pioneer’s future was cloudy.”[15]
Barton became convinced to introduce legislation to lift the export ban following industry arguments that growing U.S. production would soon outgrow its available uses at the time. “Both Conoco and Pioneer pointed out that there wasn’t a market for our growing domestic shale oil production, because our U.S. refineries were set up to process the heavier foreign oils.”[16]
U.S. shale oil is overwhelmingly light sweet crude, meaning it is low-density and has a low sulfur content. For much of the decade prior to the emergence of the shale boom, many U.S. refiners had optimized their refineries to process heavy sour crude.[17],[18] This low-quality crude is abundant primarily in Mexico, Venezuela, and Canada. During the 2000s, U.S. refiners believed secure sources of light sweet oil were in decline, and future production growth was anticipated to come primarily from sources of heavy oil, particularly the Canadian tar sands. Processing these heavier, more difficult-to-refine crude varieties meant refiners could profit from converting this cheap, low-quality feedstock into more valuable refined products, but it required large capital investments in specialized refining equipment. In America’s largest refining centers, particularly on the Gulf Coast and in the Midwest, billions of dollars were spent reconfiguring refineries to process cheap, imported heavy sour crude.[19]
As domestic production of light oil boomed in the early 2010s, refiners found ways to increase domestic light oil processing, but soon ran up against limits. Producers feared a light oil refining wall would be hit imminently, leading to a stagnation and cessation of production growth.
Following two years of intensive lobbying on Capitol Hill, a clause to repeal Section 103 of the EPCA and remove all crude oil export restrictions was inserted into a must-pass consolidated appropriations bill, which passed on December 18, 2015. However, presidential authority to reinstate restrictions was maintained, in the case of sanctions, national security, or a presidentially declared national emergency.[20]
750% Growth: Ban Lifted, Exports and Production Surge
While it is unclear exactly how U.S. refiners would have reacted to increasing light oil production had the export ban not been lifted, since restrictions were removed, virtually all U.S. production growth has gone to export.
Since December 2015, exports have grown over 750 percent, from roughly 400,000 bpd in 2015 to 3.4 million bpd in October 2019, the latest month of available figures.[21] This is an all-time monthly high, a record currently being broken every few months. Notably, this monthly average of 3.4 million bpd corresponds exactly to production growth from December 2015, when the ban was lifted, to October 2019.[22]
Exports in the ten months to October 2019 averaged over 2.9 million bpd. On an annual average basis, export growth from 2015 to 2019 of over 2.4 million bpd is 91 percent of production growth in the same period.[23]
Figure 2 shows that initial export growth was slow. This was likely due to a slight decline in U.S. production in 2016, which was itself the result of an oil price decline following a November 2014 decision by the Organization of the Petroleum Exporting Countries ( OPEC) to end production quotas. In 2017 U.S. production growth resumed, and exports followed suit and have grown steadily ever since. Prior to the export ban being lifted, about 4.75 percent of U.S. production was being exported. In 2019, that figure was 24 percent and rising.[/vc_column_text][vc_single_image image=”76693″ img_size=”full” add_caption=”yes” css=”.vc_custom_1583864084578{margin-bottom: 30px !important;}”][vc_column_text]
Domestic Light Oil Refining Has Likely Reached Its Limits; Exports May Double by 2024
Analysis from U.S. oil and gas industry experts RBN Energy suggests that U.S. refiners likely hit a limit to light oil refining in the past few years, and are unlikely to add significant refining capacity. RBN projects that exports will rise to nearly 6 million bpd by 2024 to accommodate projected production growth, a near doubling of current figures.[24]
The left chart in Figure 3 shows RBN Energy’s analysis of the projected U.S. heavy and light crude oil balance. The columns show both imports and domestic production for heavy and light oil, while the red line is the average annual throughput of all crude at U.S. refineries, a statistic known as refinery runs. The chart shows that there has been very little change in heavy oil refining since 2015, and RBN expects current heavy crude imports of around 6.5 million bpd to remain constant to at least 2024, continuing to feed the heavy crude-optimized refineries discussed above.
The red line shows a slight increase in refinery throughput up to 2018. According to RBN, this came partly from capacity increases and partly from higher utilization of existing capacity. The small 2019 decline in refinery runs is primarily due to the closure of the East Coast’s largest refinery in Philadelphia following an explosion and fire in June 2019.
The most dramatic change comes from increasing domestic light oil production, which is shown overtaking refinery runs from 2017 onwards. RBN projects an additional 3.7 million bpd of light oil production by 2024, while refinery runs are expected to increase by only 0.35 million bpd. As RBN’s John Zanner states, “(t)hat light shale oil in the portion of the blue bars above the red line effectively has no home in the U.S. market.”[25] Consequently, as the chart on the right shows, exports are projected to rise to 5.9 million bpd.[/vc_column_text][vc_single_image image=”76786″ img_size=”full” add_caption=”yes” css=”.vc_custom_1584470559065{margin-bottom: 30px !important;}”][vc_column_text]
Production Growth Is Emissions Growth
As this briefing’s main analysis will show, oil production growth lowers global oil prices, stimulates oil demand, and leads to higher global carbon dioxide emissions. Rystad Energy’s base case projection for U.S. oil production, which closely matches the EIA’s High Oil and Gas case, suggests that production could reach over 18.9 million bpd by 2032.[27] This would be over 50 percent growth from 2019 levels, and is predicated on the continued absence of climate policies or other regulation to constrain U.S. oil production. As RBN Energy’s analysis clearly shows, all of this production growth would likely be exported. If it cannot be exported, then it is highly unlikely that so much oil will be produced.
As Jim Teague, the chief executive of Enterprise Products, the U.S.’s largest crude exporter, told The Dallas Morning News in November 2019, “Without the crude oil export ban repeal, the United States would not be producing half of the oil it is today because it could not be exported.”[28]
This briefing uses a simple model of global oil supply to estimate the emissions impact of reinstating the U.S. crude oil export ban. It shows how reimplementing the ban could be a powerful tool within a suite of options to bring the United States in line with the urgent imperative to address the climate crisis.[/vc_column_text][/vc_column][/vc_row][/vc_section][vc_section el_id=”impacts”][vc_row][vc_column][vc_column_text]
Estimating the Carbon Impacts of an Export Ban
We find that reinstating the U.S. crude export ban could reduce global CO2 emissions by as much as 73 to 165 million metric tons of CO2-eq each year — the equivalent of the yearly emissions from 19 to 42 coal-fired power plants.[29] This section presents the results of a simple model and discusses the method used, while full calculation details can be found in the Appendix.
To estimate this emissions reduction, we follow the approach outlined in Jason Bordoff and Trevor Houser’s 2015 study, Navigating the US Oil Export Debate.[30],[31] They found that a lack of access to international markets would impose a discount on U.S. crude compared with the global price of oil, thereby reducing domestic production from the level it might achieve without the export restrictions.
Bordoff and Houser estimated that lifting the export ban would cause U.S. crude production to increase by 0 to 1.2 million bpd over and above the trend that would otherwise have occurred. In the absence of export restrictions, the studies reviewed by that report forecast domestic production rising 11 to 14 million bpd by 2020[32] — which is consistent with the high levels of domestic production and exports seen in recent years following the lifting of the crude export ban. Despite the complex and constantly changing landscape of the global oil industry, the method used by Bordoff and Houser remains a useful tool for understanding the impact of export restrictions.
The key parameter in estimating an export ban’s impact is the price discount that would be imposed on domestic crude oil. This discount would arise principally because U.S. refiners are configured to accept heavier grades of crude imported from Canada, Venezuela, and other regions, as discussed above. In the event of an export ban, U.S. refiners would need significant time and costly upgrades to switch their operations to accommodate the light, sweet crude produced by domestic shale producers.[33]
The discount parameter is an estimate of the per-barrel cost of the capital upgrades needed to allow U.S. refineries to handle increased volumes of domestic shale oil. If the discount were zero U.S. dollars per barrel (bbl), domestic refiners could respond to an export ban by simply switching from imported crude to domestic crude. In that case, domestic production would remain unchanged and gross crude imports would be reduced. However, this level of flexibility from U.S. refiners is unlikely.
Bordoff and Houser reviewed a number of studies assuming discounts ranging from $2 per bbl to $27 per bbl[34] and solicited a refinery consultant “to assess the cost and scale of refinery capacity additions” that would be necessary to absorb higher levels of domestic crude production. They concluded that a discount of $10 per bbl was a reasonable value for the impact of export restrictions. We adopt this same value on the assumption that domestic refinery economics remain relatively unchanged since that analysis. The continued high level of gross crude imports indicates that U.S. refiners have largely not opted to retool their operations in the years since the ban was lifted, despite large quantities of available domestic crude, meaning that the discount would still apply were the crude export ban to be reinstated.[35]
If domestic crude can only be sold at a discount to the global oil price, domestic production would decrease by an amount that depends on the discount parameter and the price elasticity of domestic supply.[36] This cut in domestic production would represent a shift in the U.S. and global supply curves, leading to a new equilibrium at a higher global oil price and a lower level of global oil consumption.
Due to uncertainty in how oil markets will evolve in future years and how they would react to a reinstated export ban, we consider several scenarios. Table 1 shows the parameters used for each scenario, chosen to show a plausible range of impacts. Following Bordoff and Houser, we consider a range of discounts from $0 per bbl to $10 per bbl, and price elasticities of supply ranging from 0.1 to 1.0. We use three scenarios for domestic production levels and global oil prices: the Reference Case and the High Oil and Gas Resource and Technology (HOG) Case from the EIA’s Annual Energy Outlook (AEO) 2019,[37] as well as the Rystad Energy UCube Base Case.[38][/vc_column_text][vc_single_image image=”76540″ img_size=”full” css=”.vc_custom_1582921969756{margin-bottom: 30px !important;}”][vc_column_text]Using these parameters, we find that a $10 per bbl discount would reduce domestic production by 1.7 million bpd in the Reference Case, 2.1 million bpd in the HOG Case, and 2.7 million bpd in the Rystad Base Case. Given the estimated decrease in U.S. production due to the export ban, we can then calculate the change in global oil consumption. The new global equilibrium point is determined by the price elasticities of supply and demand.[39],[40] Assuming price elasticities of demand (-0.3) and supply (1.0), we find that each barrel of decrease in global oil supply leads to a 0.23 barrel decrease in global oil consumption. This translates to a decrease in global crude consumption ranging from 0.39 to 0.62 million bpd for the cases considered.
Finally, the change in carbon emissions due to this decline in global oil consumption is found by multiplying the change by the emissions from consuming a barrel of crude oil. For this briefing, we use lifecycle emissions of 510 kg CO2-eq per bbl, a median figure taken from the Carnegie Endowment’s Oil Climate Index.[41] Table 2 shows the changes in U.S. production, global consumption, and annual global emissions for the scenarios considered.
We also consider the possibility that U.S. shale production supply might be more elastic than conventional oil production around the globe,[42] and consider scenarios where the global and U.S. elasticities are allowed to differ (the “split” scenarios in the bottom 3 rows of Tables 1 and 2). At the price levels analyzed (roughly $60 per /bbl to $80 per bbl), the global elasticity of supply is roughly 0.8 to 0.4,[43] which corresponds to a larger impact on global consumption, of 0.27 to 0.43 barrels less consumption for each barrel of reduced supply. This results in a larger carbon impact from reinstating the crude export ban, of 136 to 165 million metric tons (Mt) of CO2-eq per year for these “split” scenarios.[/vc_column_text][vc_single_image image=”76541″ img_size=”full” css=”.vc_custom_1582921978630{margin-bottom: 30px !important;}”][vc_column_text]The annual emissions reductions shown in Table 2 are the equivalent of 19 to 42 coal plants, or 15 to 35 million passenger vehicles driven for one year.[44] The long-term cumulative impact of reinstated export restrictions would depend on the details of how the policy is implemented, as well as other oil market trends. As a point of comparison, if President Barack Obama’s proposed light-duty vehicle standards had been fully implemented, the regulations could have led to annual emissions reductions of 27 Mt CO2-eq in 2020, rising to 271 Mt CO2-eq by 2030.[45] It is unclear whether these estimates account for carbon leakage, making exact comparisons with export restrictions difficult.[46]
Given the complexity of the global oil market and the large uncertainties in its evolution over the next decade, the scenarios and parameters considered here are only meant to provide a representative picture of how surging U.S. oil production is undermining our climate goals — and how renewed export restrictions could play a crucial part in meeting those goals. The ultimate impact of a reinstated export ban could be smaller than the values presented here, for example, if OPEC responds to the ban by increasing oil production to keep global supply constant, or if U.S. refineries are more able to adapt and their response is better described by a smaller discount.
Conversely, the impact of a crude export ban could be significantly larger than estimated here if discounts greater than $10 per bbl are considered, or if reinstating the ban prevents new investments in pipelines and other infrastructure that would help facilitate higher levels of production. This potential scenario is particularly relevant to the Permian Basin of Texas and New Mexico, which is projected to provide the majority of planned U.S. oil production growth over the next decade, primarily intended for export.[47] Relatedly, if the U.S. successfully adopts ambitious climate policies that result in declining domestic demand for oil — such as a Green New Deal or equivalent policy suite — an export ban would play a crucial role in preventing surplus domestic production from being exported, thereby reducing carbon leakage that would otherwise undermine domestic emissions reductions.[48] The political impact of reinstating the crude export ban in creating space for additional bans on fossil fuel exports could also be substantial and lead to significant future emissions reductions.[/vc_column_text][/vc_column][/vc_row][/vc_section][vc_section el_id=”transition”][vc_row][vc_column][vc_column_text]
Secure a Just and Equitable Transition Away from Fossil Fuels
Reinstating the crude export ban could drive significant emissions reductions, but it could also impact labor markets and existing jobs in the oil refining, processing, and export industries. A reimplementation of the ban would therefore require an ambitious and well-funded energy policy to prioritize justice and equity for workers and frontline and Indigenous communities in the necessary transition away from fossil fuels. A well-managed just transition[49] must address the particular needs of workers currently and formerly employed in the fossil fuel sector whose lives — as well those of their families — will be significantly disrupted, to ensure that no one is left behind.[50]
As with any industrial transition, jobs would shift from sector to sector. For more than a decade, the expansion of upstream oil drilling and related infrastructure projects has created jobs in both existing extraction communities and regions with little prior oil and gas activity. Efforts to constrain the flow of fossil fuels into our economy to ensure climate justice — including export restrictions — will contract the fossil fuel industry, and must be coupled with tailored efforts to create new, high-quality job opportunities in other industries. To the extent that crude export restrictions are part of this broader shift away from fossil fuel production, just transition policies and accompanying investment will be needed immediately to support impacted workers.
Effectively addressing and prioritizing the needs and rights of people most impacted by the transition away from fossil fuels will be one of the most important measures of success for just and equitable energy policy in 2020 and beyond. This includes workers and communities heavily dependent on the production and use of fossil fuels, as well as historically marginalized Indigenous and low-wealth communities and communities of color who have unjustly borne the burden of fossil fuel pollution and the resulting climate impacts.
If managed properly, the coming transition could stand in stark contrast to the job losses of past boom-bust cycles of the oil commodity markets, or the potential coming job losses due to various oil industry innovations, including automation. The messy and profoundly inequitable transition away from coal extraction in most of the U.S. provides a preview of what an unmanaged and unjust energy transition could look like if worker and community protections are not closely paired with declines in fossil fuel production.
To facilitate a well-managed, just transition, including with the reimplementation of the crude export ban, Congress and the president should enact policies and programs tailored to the workforce conditions of particular industrial sectors or geographic regions. Federal action should be rooted in democratic processes that provide affected workers and communities with a significant role in the design of policies and programs intended to assist them through the transition, with meaningful opportunities to review and determine the need for expansion and improvements.[/vc_column_text][/vc_column][/vc_row][/vc_section][vc_section el_id=”recommendations”][vc_row][vc_column][vc_column_text]
Recommendations
These findings show that reinstating crude oil export restrictions can be a powerful component of an ambitious U.S. climate change policy. Export restrictions would be a crucial tool in halting and reversing the ongoing domestic oil and gas production boom, and in ensuring that carbon leakage from domestic production does not undermine climate progress the U.S. makes under the next presidential administration.
The next president and Congress should consider the following in reinstating the crude export ban:
- Legally, the next president can impose export restrictions only after declaring a national emergency.[51] It is clear that climate change is already creating extreme risks for Americans from Alaska to Florida. The next president should consider declaring a climate emergency as a part of his or her response to the crisis.
- Congress should act to put crude export restrictions on a permanent legal footing by reinstating the ban, and should consider additional restrictions on exporting other fossil fuels, such as coal and liquefied natural gas, which would generate additional and substantial emissions reductions.
- The next president and Congress should reinstate the crude export ban in tandem with policies to ensure a just and equitable transition away from fossil fuels.
- Export restrictions should initially focus on preventing the continued expansion of domestic fossil fuel production and exports — to prevent the “lock-in” of additional infrastructure and emissions — and should fully phase out exports as programs to support workers and communities are implemented.
- Export restrictions give the federal government leverage over emissions beyond U.S. borders, and should be paired with an expanded commitment to international climate finance and policies to facilitate the transfer of U.S.-developed clean energy technology to other nations.
- Export restrictions such as the crude export ban should be one of a suite of policies aimed at halting the expansion of fossil fuels and aligning the phase-out of U.S. fossil fuel production with domestic and global climate targets. Other such “supply-side” policies include ending new leases for fossil fuel extraction on federal lands and waters, ending all fossil fuel subsidies and finance, and denying permits to new fossil fuel infrastructure projects.
In addition to export restrictions, the next president and Congress should implement strong just transition policies, such as the following:
- Any worker impacted by climate policies should have five years’ income and benefits guaranteed at their current level. Fossil fuel companies must be held accountable to pay the full wages and benefits promised to workers, and Congress should act as a backstop to ensure full income and benefit guarantees to fossil fuel employees who lose their jobs due to a managed phaseout of oil, gas, and coal production.[52] Wage gap coverage and insurance guarantees should be provided to workers whose new employment pays a lower wage. Access to free education, skills development, job preparation, and training should be provided to fossil fuel employees who need support to successfully transition to a new career.
- Apprenticeships and preferential hiring practices should be established to support workers transitioning out of the fossil fuel industry into industries in the green economy. Tax incentives should be provided to companies that adopt these practices with strong labor standards.[53] Support and assistance should be provided to workers and families wishing to relocate, including moving allowances and potential residential living subsidies. Early retirement should be made available with guaranteed pensions and full health benefits,[54] and adequate treatment, counseling, and community-based clinical services should be provided to workers suffering from occupational-related illnesses.
- Historically disadvantaged communities should benefit from the transition. Access to free vocational training, apprenticeships, and preferential hiring practices should be provided to low-income communities, people of color, and other disadvantaged communities.[55]
- Worker representation and collective bargaining should be expanded through the transition. Policies to enhance workers’ rights and give unions power over bargaining structures should be prioritized.
- Congress should create a federal Just Transition Office to drive economic development and expand employment in the green economy and to facilitate research and coordinate with state and local governments, stakeholders, and sector-specific planning programs.[56]
[/vc_column_text][/vc_column][/vc_row][/vc_section][vc_section el_id=”appendix”][vc_row][vc_column][vc_column_text]
Appendix: A Simple Model for Reinstating the Crude Export Ban
View the research methods appendix here.[/vc_column_text][/vc_column][/vc_row][/vc_section][vc_section el_id=”endnotes”][vc_row][vc_column][vc_column_text]
Endnotes
1. Muttitt, G. 2016. The Sky’s Limit: Why The Paris Climate Goals Require a Managed Decline of Fossil Fuel Production. Oil Change International. September. http://priceofoil.org/content/uploads/2016/09/OCI_the_skys_limit_2016_FINAL_2.pdf
2. SEI, IISD, ODI, Climate Analytics, CICERO, & UNEP. 2019. The Production Gap: The discrepancy between countries’ planned fossil fuel production and global production levels consistent with limiting warming to 1.5°C or 2°C. http://productiongap.org/
3. Trout, K. & L. Stockman. 2019. Drilling Toward Disaster: Why U.S. Oil and Gas Expansion is Incompatible With Climate Limits. Oil Change International, January. http://priceofoil.org/content/uploads/2019/01/Drilling-Towards-Disaster-Web-v2.pdf
4. Joe Barton, “Joe Barton: I knew my bill to lift the ban on U.S. oil exports was important. I hardly expected it to change the world.” The Dallas Morning News. November 24, 2019. https://www.dallasnews.com/opinion/commentary/2019/11/24/joe-barton-i-knew-my-bill-to-lift-the-ban-on-us-oil-exports-was-important-i-hardly-expected-it-to-change-the-world/
5. https://www.blm.gov/or/regulations/files/mla_1920_amendments1.pdf
6. https://www.govtrack.us/congress/bills/94/s622/text
7. S. 622 (94th) Energy Policy and Conservation Act 1975, Section 103 (b)(2). https://www.govtrack.us/congress/bills/94/s622/text
8. EIA, Exports of Crude Oil by Destination – U.S. Virgin Islands. https://www.eia.gov/dnav/pet/hist/LeafHandler.ashx?n=PET&s=MCREXVQ1&f=M; U.S. Government Accountability Office, “Alaskan North Slope Oil: Limited Effects of Lifting Export Ban on OIl and Shipping Industries and Consumers.” GAO/RCED-99-191. July 1999. https://www.gao.gov/archive/1999/rc99191.pdf
9. https://www.eia.gov/todayinenergy/detail.php?id=10851
10. Condensate is an ultra-light liquid that exists as gas in the reservoir and condenses to a liquid at surface temperature and pressure. The EIA includes condensate in its crude oil statistics if the condensate is produced in the field rather than in a gas processing plant. Condensate is abundant in U.S. shale plays, particularly in the Eagle Ford Shale in Texas.Applications to export condensate to countries other than Canada was one of the first signs of the oil industry testing the limits of the crude export regulations.
11. Lorne Stockman, ‘Should It Stay or Should It Go? The Case Against U.S. Crude Oil Exports.’ October 2013, Oil Change International. http://priceofoil.org/content/uploads/2013/10/OCI_Stay_or_Go_FINAL.pdf
12. EIA, Exports of Crude Oil By Destination – Canada https://www.eia.gov/dnav/pet/hist/LeafHandler.ashx?n=pet&s=mcrexca2&f=a
13. Daniel Gilbert, “Exxon Presses for Exports.” The Wall Street Journal. December 11, 2013. https://www.wsj.com/articles/exxon-presses-for-exports-1386820015?tesla=y
14. Jim Snyder and Mark Drajem, “Oil Industry May Invoke Trade Law to Challenge Export Ban.” Bloomberg News. November 6, 2013. https://www.bloomberg.com/news/articles/2013-11-06/oil-industry-may-invoke-trade-law-to-challenge-export-ban
15. Joe Barton 2019.
16. Joe Barton 2019.
17. RBN Energy. 2018. ‘Darkness Into Light – Domestic Light Oil Processing In The USGC: Have We Hit The Limit?’ https://rbnenergy.com/darkness-into-light-domestic-light-oil-processing-in-the-usgc-have-we-hit-the-limit
18. U.S. EIA. 2018. ‘Today in Energy: Crude oil entering Gulf Coast refineries has become lighter as imports have declined.’ October 2. https://www.eia.gov/todayinenergy/detail.php?id=36933
19. Bordoff, J. & T. Houser. 2015. Navigating the US Oil Export Debate. Center on Global Energy Policy, January, see discussion pp.22-25. https://rhg.com/research/navigating-the-us-oil-export-debate/
20. Title I, Section 101 of H.R 2029 Consolidated Appropriations Act, 2016. https://www.congress.gov/bill/114th-congress/house-bill/2029/text
21. EIA, Crude Oil Exports https://www.eia.gov/dnav/pet/pet_move_exp_dc_NUS-Z00_mbblpd_m.htm
22. EIA, Crude Oil Production. https://www.eia.gov/dnav/pet/hist/LeafHandler.ashx?n=PET&s=MCRFPUS2&f=M; December 2015 production was 9.263 million bpd; October 2019 reached 12.655 million bpd.
23. Based on EIA data for the first ten months of 2019 and the annual barrels per day figures for 2015. Production was 9.439 million bpd in 2015 https://www.eia.gov/dnav/pet/pet_crd_crpdn_adc_mbblpd_a.htm/. An average of the first ten months of 2019 comes to 12.106 million bpd https://www.eia.gov/dnav/pet/pet_crd_crpdn_adc_mbblpd_m.htm/. Exports were 465,000 bpd in 2015 https://www.eia.gov/dnav/pet/pet_move_exp_dc_NUS-Z00_mbblpd_a.htm compared to an average of 2.905 million bpd for the first ten months of 2019 https://www.eia.gov/dnav/pet/pet_move_exp_dc_NUS-Z00_mbblpd_m.htm
24. John Zanner, “Where the Boat Leaves From: How Much More Crude Export Capacity Does the US Really Need? RBN Energy, June 5, 2019. https://rbnenergy.com/where-the-boat-leaves-from-how-much-more-crude-export-capacity-does-the-us-really-need
25. John Zanner 2019.
26. John Zanner 2019.
27. Rystad Energy UCube, December 2019.
28. Joe Barton 2019.
29. U.S. Environmental Protection Agency, Greenhouse Gas Equivalency Calculator. https://www.epa.gov/energy/greenhouse-gas-equivalencies-calculator
30. Bordoff & Houser. 2015.
31. Houser, T., S. Mohan & M. Delgado. 2015. Technical Appendix: A Simplified Model of US Crude Export Restrictions. Rhodium Group, January. https://rhg.com/wp-content/uploads/2015/01/RHG_CrudeExports_TechnicalAppendix.pdf
32. Bordoff & Houser 2015, Figure 20, p. 38.
33. RBN Energy. 2018. ‘Darkness Into Light – Domestic Light Oil Processing In The USGC: Have We Hit The Limit?’ https://rbnenergy.com/darkness-into-light-domestic-light-oil-processing-in-the-usgc-have-we-hit-the-limit
34. Bordoff & Houser 2015, Figure 22, p. 41.
35. RBN Energy 2019.
36. The price elasticity of supply is defined as the percent change in supply — measured in barrels of crude — divided by the percent change in price.
37. U.S. EIA. 2019. Annual Energy Outlook 2019. Table: Petroleum and Other Liquids Supply and Disposition. https://www.eia.gov/outlooks/aeo/data/browser/#/?id=11-AEO2019&sourcekey=0
38. Rystad Energy UCube, December 2019.
39. Erickson, P. & M. Lazarus. 2014. ‘Impact of the Keystone XL pipeline on global oil markets and greenhouse gas emissions.’ Nature Climate Change, 4:778–781. https://www.nature.com/articles/nclimate2335
40. Erickson, P. & M. Lazarus. 2018. ‘Would constraining US fossil fuel production affect global CO2 emissions? A case study of US leasing policy.’ Climatic Change, 150:29–42. https://link.springer.com/article/10.1007%2Fs10584-018-2152-z
41. This represents lifecycle emissions from the median U.S. crude oil (U.S. East Texas Field) analyzed by the Carnegie Endowment for International Peace. Oil Climate Index. http://oci.carnegieendowment.org/; Note that due to much higher rates of gas flaring currently occuring in the Permian Basin, the key source of U.S. oil production growth and the basin most directly linked to oil export infrastructure, this emissions rate is likely to be conservative. See Tabuchi, H. 2019. “Despite Their Promises, Giant Energy Companies Burn Away Vast Amounts of Natural Gas.” New York Times, October 16. https://www.nytimes.com/2019/10/16/climate/natural-gas-flaring-exxon-bp.html ; Carter, L. & T. Donaghy. 2019. “Exxon and BP among worst for flaring in US oil fields despite green pledges.” Unearthed, October 17. https://unearthed.greenpeace.org/2019/10/17/exxon-bp-flaring-united-states-climate-change/
42. Laskin, M. 2017. ‘The Impact of US Shale – Changing the Shape of Energy Cycles.’ Recurrent Investment Advisors, June. https://static.spacecrafted.com/fd372422bd8a43518713c605b76c1ffb/r/be8fcb7371a246a8830b3afefb932e03/1/The%20Impact%20of%20Shale%20on%20Energy%20Cycles.pdf
43. Erickson & Lazarus 2018, Table 1.
44. EPA, Greenhouse Gas Equivalencies Calculator.
45. U.S. EPA. 2012. ‘Final Rule for Model Year 2017 and Later Light-Duty Vehicle Greenhouse Gas Emissions and Corporate Average Fuel Economy Standards.’ https://www.epa.gov/regulations-emissions-vehicles-and-engines/final-rule-model-year-2017-and-later-light-duty-vehicle
46. Emissions leakage occurs when “sources outside the scope of a greenhouse gas (GHG) emissions reduction system increase emissions as a result of that system,” and it can arise through shifts in production, shifts in investment, or price signals. Siikamäki et al. 2012. ‘Climate Policy, International Trade, and Emissions Leakage.’ Resources for the Future. https://www.rff.org/publications/issue-briefs/climate-policy-international-trade-and-emissions-leakage/
47. Trout & Stockman 2019.
48. Donaghy, T. 2019. Real Climate Leadership: Why The Next President Must Prioritize A Fossil Fuel Phase Out. Greenpeace USA, June 6. https://www.greenpeace.org/usa/reports/fossil-fuel-phaseout/
49. We use the term “just transition” here knowing that it can often provoke questions and concerns — some of which arise from the different national and historical contexts in which it has been used. See, for example, ““Just Transition” – Just What Is It? An Analysis of Language, Strategies and Projects,” Labor Network for Sustainability and Strategic Practice: Grassroots Policy Project. https://www.labor4sustainability.org/uncategorized/just-transition-just-what-is-it/
50. Brecher, J. 2019. No Worker Left Behind: Protecting Workers and Communities in the Green New Deal. Labor Network for Sustainability. https://www.labor4sustainability.org/articles/no-worker-left-behind-in-the-green-new-deal/
51. Siegel, K. & J. Su. 2019. Legal Authority for Presidential Executive Action on Climate: Legal Analysis Underpinning the #ClimatePresident Action Plan. Center for Biological Diversity, December. https://www.climatepresident.org/Legal-Authority-for-Presidential-Climate-Action.pdf
52. For more specific policy suggestions see Robert Pollin, “A Green Growth Plan for Colorado: Climate Stabilization, Good Jobs, and a Just Transition,” Department of Economics and Political Economy Research, UMass Amherst, April 2019 https://www.peri.umass.edu/publication/item/1168-a-green-growth-program-for-colorado ; Jeremy Brecher, “18 Strategies for a Green New Deal,” Labor Network for Sustainability, 2019. https://www.labor4sustainability.org/articles/18-strategies-for-a-green-new-deal-how-to-make-the-climate-mobilization-work/
53. Retention bonuses might be required for workers who remain on the job through closure. See, for example, the seven-year Diablo Canyon Nuclear plant transition plan projected for 2018 to 2025.
54. The Pension Benefit Guarantee Program (PBGP) should be adequately funded to cover an increase in claims made by workers formerly employed by fossil fuel companies eliminated by the transition to a clean energy economy. For many years the PBGP has had to compensate for the failure of corporations to provide traditional pension benefits. https://www.gao.gov/key_issues/pbgc_insurance_programs/issue_summary; The Just Transition Commission should work with Congress to anticipate the increased funding needed to rectify this failure and anticipate any increase in the number of claims filed by workers affected by the just transition. Providing for a secure parth to early retirement for fossil fuel workers is an essential element in any well-managed rapid phase-out of the fossil fuel industry. See Pollin et al., 2019.
55. See the Principles of the Millions of Jobs Coalition. http://www.millionsofjobs.org/principles/; Jeremy Brecher, “Making the Green New Deal Work for Workers,” In These Times, April 22/May 2019. https://inthesetimes.com/features/green-new-deal-worker-transition-jobs-plan.html
56. See, for example, “Building Future Security: Strategies for Restructuring the Defense Technology and Industrial Base,” Office of Technology Assessment, June 1992. OTA-ISC-530.[/vc_column_text][/vc_column][/vc_row][/vc_section]